A continued Let’s take a look:
Number of games drawing fewer than 1,000 fans: 41 (Season total: 301)
Here are the 3 lowest attended games of last week:
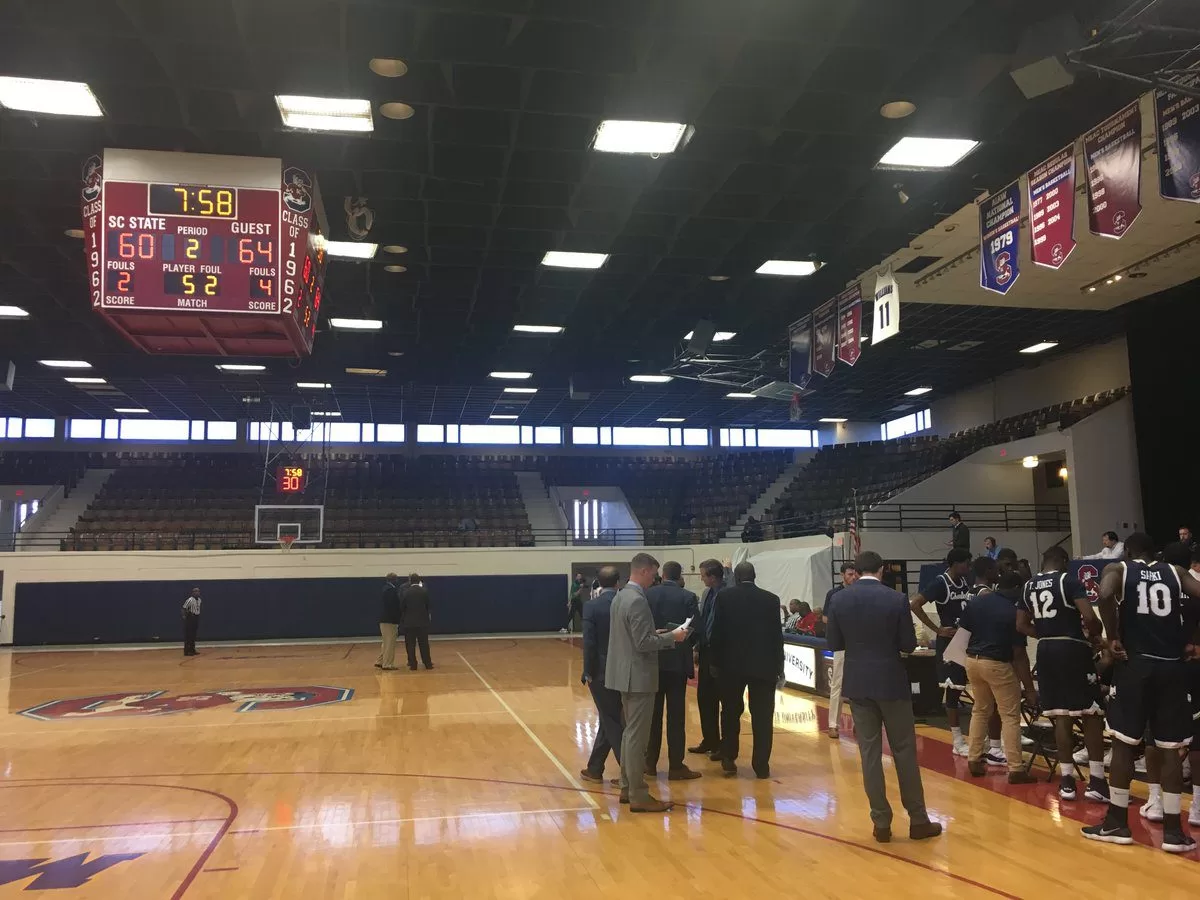
- South Carolina State vs Charleston Southern – Despite the in-state matchup, South Carolina State was only able to draw 154 fans for its tilt against Charleston Southern. This was the lowest on-campus matchup between two Division I teams all season. The lucky 154 were sent home with a Bulldogs win 91-77. A beautiful action shot:

- 2. Nicholls vs Carver-Stockton – In the “D-I against the NAIA” competition, our first entry for the week is Nicholls vs Carver-Stockton. Carver-Stockton being a small religious liberal-arts school in Northwest Missouri, but you already knew that. That apparently wasn’t enough to draw more than 122 brave souls. Unfortunately for them, there wasn’t much of a game to watch as the Colonels throttled Carver-Stockton by a score of 92-51.
- Alcorn State vs Fisk –But even 122 people in attendance wasn’t enough to get the prestigious bottom spot of the week. No, Alcorn State took home the title this week with 117 in the crowd for their game against Fisk College. The Fisk Bulldogs, a HBCU located in Nashville, were able to put up quite the fight against the Braves of Alcorn State, but the home team eventually took the win, 77-69.
So now, what happened to everyone else? Let’s go ahead with the miscellany:
Biggest group of people to see a loss at home this week: Wisconsin (vs Minnesota) 17,287.
Smallest group of people to see a win at home this week: Alcorn State (vs Fisk), 117.
Smallest Power 5 Conference attendance: USC (vs Santa Clara), 2,712.
Average attendance this week: 4,426 (down 544 [10.9%] from last week)
And as always, your full attendance numbers for the week:
| Date | Conference | Home Team | Home Score | Away Team | Away Score | Attendance | Venue | Capacity | % Full |
|---|---|---|---|---|---|---|---|---|---|
| 12/12/2017 | SWAC | Alcorn State | 77 | Fisk | 69 | 117 | Davey Whitney Complex | 7000 | 1.7% |
| 12/16/2017 | Southland | Nicholls | 92 | Culver-Stockton | 51 | 122 | Stopher Gymnasium | 3800 | 3.2% |
| 12/12/2017 | MEAC | S Carolina St | 91 | Charleston So | 88 | 154 | S-H-M Memorial Center | 3200 | 4.8% |
| 12/17/2017 | Northeast | Sacred Heart | 48 | Binghamton | 51 | 176 | William H. Pitt Center | 2062 | 8.5% |
| 12/16/2017 | Big South | Longwood | 62 | Cornell | 69 | 215 | Willett Hall | 2522 | 8.5% |
| 12/14/2017 | Big South | Presbyterian | 104 | Toccoa Falls | 35 | 230 | Ross E. Templeton P.E. Center | 2300 | 10.0% |
| 12/16/2017 | Northeast | St Francis (BKN) | 88 | SUNY Maritime | 67 | 247 | Pope Physical Education Center | 2000 | 12.4% |
| 12/14/2017 | Big Sky | N Arizona | 77 | South Dakota | 90 | 256 | J. Lawrence Walkup Skydome | 16230 | 1.6% |
| 12/16/2017 | America East | UNH | 111 | Lyndon State College | 31 | 279 | Lundholm Gymnasium | 6501 | 4.3% |
| 12/14/2017 | MEAC | Norfolk State | 112 | Mid-Atlantic | 34 | 284 | Echols Hall | 7000 | 4.1% |
| 12/16/2017 | Southern | The Citadel | 110 | Point | 66 | 347 | McAlister Field House | 6000 | 5.8% |
| 12/12/2017 | SWAC | Alabama State | 45 | Tennessee St | 64 | 362 | Dunn-Oliver Acadome | 7400 | 4.9% |
| 12/14/2017 | MEAC | Howard | 76 | Wash Adventist | 65 | 375 | Burr Gymnasium | 2700 | 13.9% |
| 12/12/2017 | Patriot League | Colgate | 87 | NJIT | 76 | 377 | Cotterell Court | 3000 | 12.6% |
| 12/14/2017 | MEAC | NC Central | 77 | McNeese | 71 | 377 | McDougald-McLendon Arena | 3500 | 10.8% |
| 12/16/2017 | MEAC | Norfolk State | 82 | Niagara | 85 | 381 | Echols Hall | 7000 | 5.4% |
| 12/13/2017 | SWAC | Alabama A&M | 54 | Southern Miss | 69 | 382 | T.M. Elmore Gymnasium | 6000 | 6.4% |
| 12/16/2017 | Big Sky | Portland State | 116 | Linfield | 71 | 402 | Pamplin Sports Center | 2300 | 17.5% |
| 12/17/2017 | Northeast | Bryant | 68 | Siena | 87 | 406 | Chace Athletic Center | 2700 | 15.0% |
| 12/14/2017 | SWAC | Southern | 68 | Florida A&M | 50 | 421 | F. G. Clark Activity Center | 7500 | 5.6% |
| 12/16/2017 | Southland | SE Louisiana | 67 | Grambling | 68 | 425 | University Center (LA) | 7500 | 5.7% |
| 12/16/2017 | Atlantic Sun | NJIT | 71 | Fair Dickinson | 68 | 435 | NJIT Wellness and Events Center | 3500 | 12.4% |
| 12/15/2017 | Southland | Houston Baptist | 100 | Barclay | 65 | 437 | Sharp Gymnasium | 1500 | 29.1% |
| 12/12/2017 | Northeast | St Francis (BKN) | 64 | Army | 76 | 475 | Pope Physical Education Center | 2000 | 23.8% |
| 12/14/2017 | Southland | SE Louisiana | 106 | Southern-New Orleans | 77 | 525 | University Center (LA) | 7500 | 7.0% |
| 12/15/2017 | Big South | Charleston So | 65 | E Kentucky | 70 | 556 | CSU Field House | 881 | 63.1% |
| 12/17/2017 | Patriot League | Boston U | 69 | Elon | 77 | 565 | Case Gym | 1800 | 31.4% |
| 12/15/2017 | Southland | Sam Houston | 57 | Little Rock | 55 | 636 | Bernard G. Johnson Coliseum | 6110 | 10.4% |
| 12/14/2017 | Southern | VMI | 90 | SWesleya | 52 | 661 | Cameron Hall | 5020 | 13.2% |
| 12/12/2017 | MEAC | Bethune-Cookman | 67 | Cal Poly | 53 | 704 | Moore Gymnasium | 3000 | 23.5% |
| 12/16/2017 | Atlantic Sun | Kennesaw State | 81 | Bethune-Cookman | 74 | 708 | KSU Convocation Center | 4792 | 14.8% |
| 12/15/2017 | Big Sky | Idaho | 73 | SimnFrsr | 54 | 719 | Cowan Spectrum | 7000 | 10.3% |
| 12/16/2017 | Western Athletic | Chicago State | 58 | Bradley | 84 | 750 | Jones Convocation Center | 7000 | 10.7% |
| 12/16/2017 | Western Athletic | UT Rio Grande | 65 | UT Arlington | 86 | 774 | UTRGV Fieldhouse | 2500 | 31.0% |
| 12/17/2017 | America East | UMBC | 76 | N Kentucky | 75 | 781 | RAC Arena | 4024 | 19.4% |
| 12/11/2017 | SWAC | Jackson State | 60 | Fisk | 53 | 821 | Lee E. Williams Athletic and Assembly Center | 8000 | 10.3% |
| 12/16/2017 | Conference USA | UTSA | 95 | Bethany | 67 | 838 | UTSA Convocation Center | 4080 | 20.5% |
| 12/16/2017 | Southland | Northwestern St | 84 | LSU Shreveport | 85 | 877 | Gold Dome | 3000 | 29.2% |
| 12/17/2017 | MAC | Miami (OH) | 109 | Rio Grande | 70 | 907 | Millett Hall | 6400 | 14.2% |
| 12/12/2017 | Colonial Athletic | Georgia State | 90 | Point | 70 | 914 | GSU Sports Arena | 4500 | 20.3% |
| 12/17/2017 | Northeast | LIU Brooklyn | 56 | St Peter’s | 71 | 987 | Barclays Center | 17732 | 5.6% |
| 12/14/2017 | Atlantic Sun | Lipscomb | 100 | Florida College | 68 | 1007 | Allen Arena | 5028 | 20.0% |
| 12/15/2017 | Southland | Texas A&M-CC | 71 | St Marys | 55 | 1011 | Dugan Wellness Center | 1100 | 91.9% |
| 12/14/2017 | Southern | Furman | 103 | Montreat | 47 | 1014 | Timmons Arena | 4000 | 25.4% |
| 12/17/2017 | Ohio Valley | Tenn Tech | 82 | Chattanooga | 76 | 1039 | Hooper Eblen Center | 9282 | 11.2% |
| 12/16/2017 | Big South | C. Carolina | 83 | Montreat | 70 | 1052 | The HTC Center | 3212 | 32.8% |
| 12/14/2017 | Big South | Campbell | 87 | The Citadel | 77 | 1131 | Pope Convocation Center | 3095 | 36.5% |
| 12/13/2017 | Big Sky | N Colorado | 83 | Denver | 63 | 1153 | Bank of Colorado Arena | 4500 | 25.6% |
| 12/12/2017 | America East | UMBC | 81 | Coppin State | 74 | 1166 | RAC Arena | 4024 | 29.0% |
| 12/13/2017 | Atlantic 10 | Duquesne | 73 | Miss Valley St | 49 | 1175 | A.J. Palumbo Center | 4406 | 26.7% |
| 12/11/2017 | America East | Hartford | 86 | Sacred Heart | 72 | 1182 | Chase Arena | 4107 | 28.8% |
| 12/17/2017 | Atlantic 10 | Duquesne | 74 | NC A&T | 58 | 1201 | A.J. Palumbo Center | 4406 | 27.3% |
| 12/17/2017 | Atlantic Sun | Lipscomb | 67 | Abil Christian | 65 | 1205 | Allen Arena | 5028 | 24.0% |
| 12/16/2017 | Ohio Valley | Jacksonville St | 77 | USC Upstate | 61 | 1222 | Pete Mathews Coliseum | 5300 | 23.1% |
| 12/15/2017 | Northeast | Mt St Mary’s | 89 | Wash. College | 67 | 1225 | Knott Arena | 3121 | 39.3% |
| 12/16/2017 | Summit League | Fort Wayne | 88 | Stetson | 84 | 1237 | Allen County War Memorial Coliseum | 13000 | 9.5% |
| 12/17/2017 | Atlantic 10 | La Salle | 95 | Mercer | 85 | 1251 | Tom Gola Arena | 4000 | 31.3% |
| 12/17/2017 | Big Sky | E Washington | 86 | CSU Northridge | 58 | 1279 | Reese Court | 6000 | 21.3% |
| 12/16/2017 | MAAC | Rider | 90 | Wagner | 84 | 1328 | Alumni Gymnasium (Rider) | 1650 | 80.5% |
| 12/11/2017 | MEAC | Florida A&M | 89 | North Florida | 101 | 1389 | Al Lawson Center | 8470 | 16.4% |
| 12/12/2017 | Sun Belt | UL Monroe | 59 | Grambling | 57 | 1391 | Fant-Ewing Coliseum | 7085 | 19.6% |
| 12/16/2017 | Big Sky | Southern Utah | 86 | Cent Michigan | 80 | 1406 | America First Events Center | 5300 | 26.5% |
| 12/16/2017 | West Coast | San Diego | 83 | North Texas | 86 | 1419 | Jenny Craig Pavilion | 5100 | 27.8% |
| 12/17/2017 | Big South | UNC Asheville | 72 | W Carolina | 76 | 1423 | U.S. Cellular Center (NC) | 7654 | 18.6% |
| 12/17/2017 | Mountain West | San Jose State | 62 | South Dakota | 76 | 1424 | Event Center (San Jose St.) | 5000 | 28.5% |
| 12/16/2017 | Ohio Valley | Belmont | 79 | Pepperdine | 62 | 1427 | Curb Event Center | 5085 | 28.1% |
| 12/17/2017 | Summit League | Omaha | 99 | CrnllIA | 58 | 1467 | Baxter Arena | 7500 | 19.6% |
| 12/13/2017 | Atlantic Sun | North Florida | 87 | FIU | 85 | 1479 | UNF Arena | 5800 | 25.5% |
| 12/12/2017 | Ivy League | Princeton | 69 | Monmouth | 58 | 1549 | Jadwin Gymnasium | 6854 | 22.6% |
| 12/12/2017 | MAAC | Iona | 83 | Yale | 67 | 1553 | Hynes Athletics Center | 2611 | 59.5% |
| 12/16/2017 | Western Athletic | Seattle | 89 | Portland | 76 | 1569 | KeyArena | 17072 | 9.2% |
| 12/13/2017 | Ohio Valley | Belmont | 82 | Milwaukee | 63 | 1612 | Curb Event Center | 5085 | 31.7% |
| 12/12/2017 | Big East | Seton Hall | 84 | St Peter’s | 61 | 1655 | Walsh Gymnasium | 2600 | 63.7% |
| 12/12/2017 | Summit League | North Dakota St | 101 | Valley City St | 58 | 1661 | Scheels Center | 6000 | 27.7% |
| 12/16/2017 | Horizon League | Milwaukee | 73 | Loyola-Chicago | 56 | 1705 | UW-Milwaukee Panther Arena | 12700 | 13.4% |
| 12/12/2017 | Summit League | South Dakota St | 99 | North Dakota | 63 | 1874 | Frost Arena | 6500 | 28.8% |
| 12/16/2017 | Conference USA | Southern Miss | 75 | William Carey | 58 | 1914 | Reed Green Coliseum | 8095 | 23.6% |
| 12/11/2017 | The American | USF | 53 | FIU | 65 | 2040 | USF Sun Dome | 10411 | 19.6% |
| 12/16/2017 | Big South | Liberty | 96 | KY Christian | 40 | 2063 | Vines Center | 8085 | 25.5% |
| 12/14/2017 | The American | USF | 83 | Bethune-Cookman | 63 | 2091 | USF Sun Dome | 10411 | 20.1% |
| 12/17/2017 | Missouri Valley | S Illinois | 71 | Lamar | 61 | 2136 | SIU Arena | 8339 | 25.6% |
| 12/13/2017 | Missouri Valley | S Illinois | 69 | Jackson State | 51 | 2151 | SIU Arena | 8339 | 25.8% |
| 12/16/2017 | MAC | Akron | 81 | Miss Valley St | 63 | 2155 | James A. Rhodes Arena | 5500 | 39.2% |
| 12/16/2017 | MAC | Buffalo | 86 | Robert Morris | 70 | 2158 | Alumni Arena | 6100 | 35.4% |
| 12/17/2017 | Ohio Valley | Morehead State | 98 | Cent Arkansas | 94 | 2208 | Ellis T. Johnson Arena | 6500 | 34.0% |
| 12/15/2017 | West Coast | San Francisco | 74 | UC Davis | 61 | 2231 | War Memorial Gymnasium | 5300 | 42.1% |
| 12/13/2017 | Summit League | Omaha | 77 | Arkansas State | 74 | 2250 | Baxter Arena | 7500 | 30.0% |
| 12/16/2017 | Ohio Valley | Murray State | 100 | Marist | 63 | 2250 | CFSB Center | 8602 | 26.2% |
| 12/16/2017 | West Coast | Pacific | 76 | UNLV | 81 | 2279 | Alex G. Spanos Center | 6150 | 37.1% |
| 12/13/2017 | Southern | UNCG | 71 | UNC Wilmington | 58 | 2307 | Greensboro Coliseum | 21273 | 10.8% |
| 12/16/2017 | Big West | Cal Poly | 60 | Princeton | 80 | 2360 | Mott Athletics Center | 3032 | 77.8% |
| 12/16/2017 | Big West | Long Beach St | 80 | E Michigan | 85 | 2391 | Walter Pyramid | 5000 | 47.8% |
| 12/17/2017 | MAAC | Fairfield | 77 | Old Dominion | 82 | 2410 | Alumni Hall | 5710 | 42.2% |
| 12/16/2017 | Horizon League | Green Bay | 86 | WI-Parkside | 50 | 2458 | Resch Center | 10200 | 24.1% |
| 12/16/2017 | America East | Albany | 68 | Canisius | 65 | 2541 | SEFCU Arena | 4538 | 56.0% |
| 12/12/2017 | Atlantic 10 | George Mason | 51 | Ga Southern | 74 | 2607 | EagleBank Arena | 10000 | 26.1% |
| 12/14/2017 | Western Athletic | Utah Valley | 106 | Bethesda | 44 | 2705 | UCCU Center | 8500 | 31.8% |
| 12/14/2017 | Pac 12 | USC | 82 | Santa Clara | 59 | 2712 | Galen Center | 10258 | 26.4% |
| 12/12/2017 | America East | Stony Brook | 81 | Hofstra | 84 | 2735 | Island FCU Arena | 4000 | 68.4% |
| 12/17/2017 | Mountain West | Colorado State | 66 | Texas State | 58 | 2737 | Moby Arena | 8745 | 31.3% |
| 12/17/2017 | The American | Houston | 92 | PV A&M | 72 | 2788 | H&PE Arena | 8100 | 34.4% |
| 12/16/2017 | West Coast | Saint Mary’s | 73 | UC Irvine | 66 | 2809 | McKeon Pavilion | 3500 | 80.3% |
| 12/17/2017 | Big Sky | Montana | 77 | UC Riverside | 61 | 2817 | Dahlberg Arena | 7321 | 38.5% |
| 12/16/2017 | ACC | Pitt | 72 | McNeese | 51 | 2830 | Petersen Events Center | 12508 | 22.6% |
| 12/12/2017 | Missouri Valley | Indiana State | 85 | Green Bay | 63 | 2924 | Hulman Center | 10200 | 28.7% |
| 12/17/2017 | Missouri Valley | Evansville | 79 | Midway | 52 | 3010 | Ford Center | 19164 | 15.7% |
| 12/17/2017 | MEAC | Hampton | 79 | UL Lafayette | 80 | 3112 | Convocation Center (VA) | 7200 | 43.2% |
| 12/11/2017 | America East | Vermont | 81 | Siena | 57 | 3266 | Patrick Gymnasium | 3228 | 101.2% |
| 12/15/2017 | Pac 12 | Stanford | 75 | Denver | 62 | 3303 | Maples Pavilion | 7329 | 45.1% |
| 12/14/2017 | The American | Tulsa | 77 | PV A&M | 73 | 3315 | Reynolds Center | 8355 | 39.7% |
| 12/16/2017 | Atlantic Sun | FGCU | 64 | Oral Roberts | 83 | 3316 | Alico Arena | 4500 | 73.7% |
| 12/16/2017 | The American | Tulsa | 80 | Manhattan | 66 | 3382 | Reynolds Center | 8355 | 40.5% |
| 12/12/2017 | Big Ten | Rutgers | 75 | Fordham | 63 | 3389 | Louis Brown Athletic Center | 8000 | 42.4% |
| 12/12/2017 | Western Athletic | New Mexico St | 84 | E. New Mexico | 62 | 3431 | Pan American Center | 13071 | 26.2% |
| 12/12/2017 | Conference USA | LA Tech | 71 | Louisiana | 75 | 3438 | Thomas Assembly Center | 8098 | 42.5% |
| 12/12/2017 | The American | UCF | 61 | SE Louisiana | 53 | 3449 | CFE Arena | 9465 | 36.4% |
| 12/17/2017 | Pac 12 | USC | 98 | UCSB | 87 | 3519 | Galen Center | 10258 | 34.3% |
| 12/17/2017 | Atlantic 10 | Saint Joe’s | 72 | Maine | 59 | 3551 | Hagan Arena | 4200 | 84.5% |
| 12/16/2017 | Atlantic 10 | G Washington | 50 | Miami | 59 | 3862 | Charles E. Smith Center | 4338 | 89.0% |
| 12/16/2017 | MAC | Toledo | 69 | Wright State | 77 | 3932 | Savage Arena | 9000 | 43.7% |
| 12/12/2017 | ACC | Boston College | 81 | Columbia | 66 | 3989 | Silvio Conte Forum | 8606 | 46.4% |
| 12/17/2017 | Pac 12 | Stanford | 71 | San Francisco | 59 | 4031 | Maples Pavilion | 7329 | 55.0% |
| 12/12/2017 | Ohio Valley | Morehead State | 85 | KY Christian | 57 | 4157 | Ellis T. Johnson Arena | 6500 | 64.0% |
| 12/17/2017 | Colonial Athletic | UNC Wilmington | 84 | Furman | 90 | 4236 | Trask Coliseum | 6100 | 69.4% |
| 12/12/2017 | Mountain West | Wyoming | 93 | E Washington | 88 | 4363 | Arena-Auditorium | 15028 | 29.0% |
| 12/16/2017 | Conference USA | W Kentucky | 81 | Indiana State | 65 | 4412 | E. A. Diddle Arena | 7326 | 60.2% |
| 12/16/2017 | Mountain West | Wyoming | 72 | Texas Southern | 66 | 4487 | Arena-Auditorium | 15028 | 29.9% |
| 12/17/2017 | ACC | Boston College | 84 | Cent Conn St | 65 | 4669 | Silvio Conte Forum | 8606 | 54.3% |
| 12/13/2017 | Missouri Valley | Bradley | 86 | Little Rock | 46 | 4670 | Carver Arena | 11164 | 41.8% |
| 12/16/2017 | Atlantic 10 | UMass | 72 | Georgia | 62 | 4744 | William D. Mullins Memorial Center | 9493 | 50.0% |
| 12/12/2017 | Atlantic 10 | Saint Louis | 69 | Murray State | 55 | 4971 | Chaifetz Arena | 10600 | 46.9% |
| 12/11/2017 | Big Ten | Northwestern | 96 | Chicago State | 31 | 5007 | Allstate Arena | 17500 | 28.6% |
| 12/13/2017 | SEC | Ole Miss | 82 | Sam Houston | 69 | 5054 | The Pavilion at Ole Miss | 9500 | 53.2% |
| 12/16/2017 | Conference USA | Marshall | 99 | Ohio | 96 | 5117 | Cam Henderson Center | 10705 | 47.8% |
| 12/17/2017 | ACC | Georgia Tech | 79 | Florida A&M | 54 | 5156 | McCamish Pavilion | 9191 | 56.1% |
| 12/14/2017 | Conference USA | Rice | 91 | St. Edward’s | 86 | 5208 | Tudor Fieldhouse | 5750 | 90.6% |
| 12/14/2017 | Big Ten | Northwestern | 84 | Valparaiso | 50 | 5299 | Allstate Arena | 17500 | 30.3% |
| 12/16/2017 | The American | Temple | 63 | Drexel | 60 | 5324 | Liacouras Center | 10206 | 52.2% |
| 12/17/2017 | Atlantic 10 | George Mason | 54 | Penn State | 72 | 5439 | EagleBank Arena | 10000 | 54.4% |
| 12/14/2017 | Big 12 | Baylor | 99 | Texas Southern | 68 | 5459 | Ferrell Center | 10347 | 52.8% |
| 12/17/2017 | Big East | Providence | 62 | Stony Brook | 60 | 5742 | Dunkin Donuts Center | 12400 | 46.3% |
| 12/16/2017 | Atlantic 10 | St Bonaventure | 81 | Vermont | 79 | 5828 | Blue Cross Arena | 12428 | 46.9% |
| 12/16/2017 | West Coast | Gonzaga | 89 | North Dakota | 83 | 6000 | McCarthey Athletic Center | 6000 | 100.0% |
| 12/16/2017 | SEC | Ole Miss | 97 | Illinois State | 101 | 6309 | The Pavilion at Ole Miss | 9500 | 66.4% |
| 12/13/2017 | SEC | Texas A&M | 113 | Savannah State | 66 | 6339 | Reed Arena | 12989 | 48.8% |
| 12/12/2017 | Pac 12 | Colorado | 59 | San Diego | 69 | 6512 | Coors Events Center | 11064 | 58.9% |
| 12/13/2017 | The American | SMU | 79 | New Orleans | 66 | 6512 | Moody Coliseum | 8998 | 72.4% |
| 12/16/2017 | The American | Memphis | 72 | Louisville | 81 | 6525 | Madison Square Garden | 19812 | 32.9% |
| 12/16/2017 | Big Sky | Weber State | 96 | AR-Pine Bluff | 74 | 6544 | Dee Events Center | 11500 | 56.9% |
| 12/16/2017 | Pac 12 | Cal | 95 | CSU Fullerton | 89 | 6758 | Haas Pavilion | 11877 | 56.9% |
| 12/17/2017 | Big 12 | Baylor | 118 | Savannah State | 86 | 6996 | Ferrell Center | 10347 | 67.6% |
| 12/16/2017 | Big East | DePaul | 60 | Northwestern | 62 | 7001 | Wintrust Arena | 10387 | 67.4% |
| 12/16/2017 | Big 12 | Texas Tech | 73 | Rice | 53 | 7034 | Lubbock Municipal Coliseum | 8344 | 84.3% |
| 12/16/2017 | SEC | Auburn | 76 | Mid Tennessee | 70 | 7209 | Legacy Arena at BJCC | 17654 | 40.8% |
| 12/17/2017 | Mountain West | Nevada | 77 | Radford | 62 | 7272 | Lawlor Events Center | 11536 | 63.0% |
| 12/16/2017 | Big 12 | Kansas State | 89 | SE Missouri St | 71 | 7389 | Bramlage Coliseum | 13762 | 53.7% |
| 12/16/2017 | Atlantic 10 | VCU | 85 | Bucknell | 79 | 7637 | Stuart C. Siegel Center | 7637 | 100.0% |
| 12/12/2017 | The American | Cincinnati | 65 | Miss St | 50 | 8128 | BB&T Arena | 9400 | 86.5% |
| 12/16/2017 | Big Ten | Rutgers | 71 | Seton Hall | 65 | 8318 | Louis Brown Athletic Center | 8000 | 104.0% |
| 12/13/2017 | SEC | LSU | 80 | Houston | 77 | 8449 | Pete Maravich Assembly Center | 14351 | 58.9% |
| 12/16/2017 | Big 12 | West Virginia | 98 | Wheeling Jesuit | 50 | 8502 | WVU Coliseum | 14000 | 60.7% |
| 12/16/2017 | Big 12 | Texas | 75 | LA Tech | 60 | 8828 | Frank Erwin Center | 16837 | 52.4% |
| 12/16/2017 | SEC | Florida | 69 | Clemson | 71 | 9152 | BB&T Center | 20737 | 44.1% |
| 12/16/2017 | Mountain West | Fresno State | 61 | Oregon | 68 | 9225 | Save Mart Center | 15544 | 59.3% |
| 12/17/2017 | Big East | St John’s | 69 | Iona | 59 | 9515 | Madison Square Garden | 19812 | 48.0% |
| 12/16/2017 | SEC | LSU | 82 | SF Austin | 83 | 9695 | Pete Maravich Assembly Center | 14351 | 67.6% |
| 12/16/2017 | Pac 12 | UCLA | 63 | Cincinnati | 77 | 10018 | Pauley Pavilion | 12829 | 78.1% |
| 12/13/2017 | The American | Temple | 67 | Villanova | 87 | 10206 | Liacouras Center | 10206 | 100.0% |
| 12/16/2017 | Big East | Xavier | 68 | ETSU | 66 | 10432 | Cintas Center | 10250 | 101.8% |
| 12/17/2017 | Pac 12 | Arizona State | 76 | Vanderbilt | 64 | 10797 | Wells Fargo Arena (AZ) | 10754 | 100.4% |
| 12/11/2017 | Big Ten | Minnesota | 68 | Drake | 67 | 11319 | Williams Arena | 14625 | 77.4% |
| 12/13/2017 | Big Ten | Illinois | 92 | Longwood | 45 | 12387 | State Farm Center | 15500 | 79.9% |
| 12/12/2017 | Big 12 | Texas | 52 | Michigan | 59 | 12504 | Frank Erwin Center | 16837 | 74.3% |
| 12/12/2017 | Big Ten | Maryland | 76 | Catholic Univ. | 59 | 12540 | XFINITY Center | 17950 | 69.9% |
| 12/16/2017 | Big Ten | OSU | 80 | Appalachian St | 67 | 12616 | Value City Arena | 18809 | 67.1% |
| 12/16/2017 | Atlantic 10 | Dayton | 88 | Georgia State | 83 | 13005 | University of Dayton Arena | 13435 | 96.8% |
| 12/16/2017 | Mountain West | New Mexico | 73 | Arizona | 89 | 13207 | Dreamstyle Arena | 15411 | 85.7% |
| 12/16/2017 | Missouri Valley | Northern Iowa | 65 | Iowa State | 76 | 13828 | Wells Fargo Arena | 16110 | 85.8% |
| 12/16/2017 | ACC | UVA | 80 | Davidson | 60 | 13910 | John Paul Jones Arena | 14593 | 95.3% |
| 12/16/2017 | ACC | NC State | 76 | UNCG | 81 | 13957 | PNC Arena | 18680 | 74.7% |
| 12/16/2017 | The American | Wichita State | 83 | Oklahoma | 91 | 15004 | Charles Koch Arena | 10506 | 142.8% |
| 12/16/2017 | Big East | Georgetown | 79 | Syracuse | 86 | 15418 | Capital One Arena | 20356 | 75.7% |
| 12/11/2017 | ACC | Louisville | 102 | Bryant | 59 | 16236 | KFC Yum! Center | 22090 | 73.5% |
| 12/16/2017 | West Coast | BYU | 77 | Utah | 65 | 16272 | Marriott Center | 22700 | 71.7% |
| 12/16/2017 | SEC | Arkansas | 88 | Troy | 63 | 16416 | Verizon Arena | 18000 | 91.2% |
| 12/15/2017 | Big East | Creighton | 87 | MD-E Shore | 36 | 16520 | CenturyLink Center Omaha | 17100 | 96.6% |
| 12/13/2017 | Big Ten | Wisconsin | 81 | W Kentucky | 80 | 17287 | Kohl Center | 17230 | 100.3% |
| 12/16/2017 | ACC | Notre Dame | 77 | Indiana | 80 | 18680 | Bankers Life Fieldhouse | 18165 | 102.8% |
| 12/16/2017 | Horizon League | Oakland | 73 | Michigan State | 86 | 20695 | Little Caesars Arena | 20491 | 101.0% |
| 12/17/2017 | SEC | Tennessee | 73 | UNC | 78 | 21678 | Thompson-Boling Arena | 21678 | 100.0% |
| 12/16/2017 | SEC | Kentucky | 93 | Virginia Tech | 86 | 22690 | Rupp Arena | 23500 | 96.6% |
| 12/9/2017 | Western Athletic | Grand Canyon | 87 | Grambling | 53 | 6829 | GCU Arena | 7000 | 97.6% |
| 12/5/2017 | Big 12 | TCU | 94 | SMU | 83 | 6840 | Ed and Rae Schollmaier Arena | 7201 | 95.0% |
| 12/5/2017 | ACC | Miami | 69 | Boston U | 54 | 6893 | Watsco Center | 7972 | 86.5% |
| 12/5/2017 | Big 12 | Kansas State | 86 | USC Upstate | 49 | 6911 | Bramlage Coliseum | 13762 | 50.2% |
| 12/9/2017 | Big 12 | Kansas State | 54 | Tulsa | 61 | 7180 | Intrust Bank Arena | 15004 | 47.9% |
| 12/6/2017 | ACC | Virginia Tech | 95 | Radford | 68 | 7265 | Cassell Coliseum | 9847 | 73.8% |
| 12/9/2017 | The American | Temple | 81 | Saint Joe’s | 78 | 7288 | Liacouras Center | 10206 | 71.4% |
| 12/6/2017 | ACC | Florida State | 96 | Loyola (MD) | 71 | 7323 | Donald L. Tucker Center | 12100 | 60.5% |
| 12/9/2017 | ACC | Clemson | 81 | Samford | 59 | 7434 | Littlejohn Coliseum | 9000 | 82.6% |
| 12/5/2017 | Atlantic 10 | VCU | 67 | Texas | 71 | 7637 | Stuart C. Siegel Center | 7637 | 100.0% |
| 12/5/2017 | Big East | Butler | 81 | Utah | 69 | 7638 | Hinkle Fieldhouse | 9100 | 83.9% |
| 12/9/2017 | ACC | Pitt | 60 | West Virginia | 69 | 7748 | Petersen Events Center | 12508 | 61.9% |
| 12/9/2017 | SEC | Texas A&M | 73 | PV A&M | 53 | 7804 | Reed Arena | 12989 | 60.1% |
| 12/10/2017 | SEC | LSU | 97 | UNC Wilmington | 84 | 7812 | Pete Maravich Assembly Center | 14351 | 54.4% |
| 12/9/2017 | SEC | Auburn | 85 | UAB | 80 | 7965 | Auburn Arena | 9121 | 87.3% |
| 12/9/2017 | Big East | Butler | 95 | Youngstown St | 67 | 8022 | Hinkle Fieldhouse | 9100 | 88.2% |
| 12/9/2017 | ACC | Boston College | 89 | Duke | 84 | 8606 | Silvio Conte Forum | 8606 | 100.0% |
| 12/6/2017 | SEC | Vanderbilt | 63 | Mid Tennessee | 66 | 8739 | Memorial Gymnasium (Vandy) | 15626 | 55.9% |
| 12/4/2017 | Big 12 | Oklahoma | 97 | UTSA | 85 | 8793 | Lloyd Noble Center | 11528 | 76.3% |
| 12/9/2017 | Conference USA | Mid Tennessee | 77 | Ole Miss | 58 | 8806 | Murphy Athletic Center | 11807 | 74.6% |
| 12/5/2017 | ACC | Notre Dame | 77 | Ball State | 80 | 8891 | Purcell Pavilion | 9149 | 97.2% |
| 12/5/2017 | Pac 12 | Arizona | 67 | Texas A&M | 64 | 8907 | Talking Stick Resort Arena | 18055 | 49.3% |
| 12/6/2017 | SEC | Florida | 59 | Loyola-Chicago | 65 | 9012 | Exactech Arena | 12000 | 75.1% |
| 12/9/2017 | MAAC | Siena | 69 | Albany | 74 | 9017 | Times Union Center | 15229 | 59.2% |
| 12/9/2017 | SEC | Florida | 66 | Cincinnati | 60 | 9112 | Prudential Center | 17625 | 51.7% |
| 12/5/2017 | ACC | Duke | 124 | St Francis (PA) | 67 | 9314 | Cameron Indoor Stadium | 9314 | 100.0% |
| 12/9/2017 | Big 12 | Oklahoma State | 66 | Wichita State | 78 | 9655 | Gallagher-Iba Arena | 13611 | 70.9% |
| 12/5/2017 | Big 12 | Texas Tech | 82 | Nevada | 76 | 9872 | United Supermarkets Arena | 15020 | 65.7% |
| 12/6/2017 | SEC | South Carolina | 80 | Wyoming | 64 | 10205 | Colonial Life Arena | 18000 | 56.7% |
| 12/9/2017 | Big East | Xavier | 96 | Colorado | 69 | 10228 | Cintas Center | 10250 | 99.8% |
| 12/6/2017 | Big East | Xavier | 96 | Kent State | 70 | 10292 | Cintas Center | 10250 | 100.4% |
| 12/4/2017 | SEC | Florida | 66 | Florida State | 83 | 10425 | Exactech Arena | 12000 | 86.9% |
| 12/9/2017 | SEC | Kentucky | 93 | Monmouth | 76 | 10438 | Madison Square Garden | 19812 | 52.7% |
| 12/5/2017 | The American | Wichita State | 95 | South Dakota St | 85 | 10506 | Charles Koch Arena | 10506 | 100.0% |
| 12/10/2017 | Big East | Villanova | 77 | La Salle | 68 | 10611 | Wells Fargo Center | 21600 | 49.1% |
| 12/9/2017 | Big Ten | OSU | 97 | William & Mary | 62 | 11158 | Value City Arena | 18809 | 59.3% |
| 12/9/2017 | Mountain West | San Diego State | 62 | Cal | 63 | 11381 | Viejas Arena | 12414 | 91.7% |
| 12/10/2017 | Big Ten | Iowa | 91 | Southern | 60 | 11397 | Carver-Hawkeye Arena | 15500 | 73.5% |
| 12/9/2017 | SEC | South Carolina | 80 | C. Carolina | 78 | 11734 | Colonial Life Arena | 18000 | 65.2% |
| 12/5/2017 | Big East | Marquette | 91 | Vermont | 81 | 12055 | BMO Harris Bradley Center | 17845 | 67.6% |
| 12/9/2017 | Big Ten | Michigan | 78 | UCLA | 69 | 12137 | Crisler Center | 13751 | 88.3% |
| 12/6/2017 | West Coast | BYU | 80 | Illinois State | 68 | 12250 | Marriott Center | 22700 | 54.0% |
| 12/6/2017 | Big Ten | Illinois | 64 | Austin Peay | 57 | 12352 | State Farm Center | 15500 | 79.7% |
| 12/4/2017 | Big Ten | OSU | 71 | Michigan | 62 | 12546 | Value City Arena | 18809 | 66.7% |
| 12/9/2017 | Big Ten | Maryland | 82 | Gardner-Webb | 60 | 12588 | XFINITY Center | 17950 | 70.1% |
| 12/6/2017 | ACC | UNC | 104 | W Carolina | 61 | 12720 | Dean E. Smith Center | 21750 | 58.5% |
| 12/9/2017 | Mountain West | New Mexico | 62 | New Mexico St | 65 | 12768 | Dreamstyle Arena | 15411 | 82.8% |
| 12/6/2017 | SEC | Alabama | 68 | URI | 64 | 12807 | Coleman Coliseum | 15383 | 83.3% |
| 12/5/2017 | Big 12 | West Virginia | 68 | UVA | 61 | 12816 | WVU Coliseum | 14000 | 91.5% |
| 12/7/2017 | Big Ten | Maryland | 87 | Ohio | 62 | 12914 | XFINITY Center | 17950 | 71.9% |
| 12/6/2017 | Atlantic 10 | Dayton | 79 | Tenn Tech | 66 | 12976 | University of Dayton Arena | 13435 | 96.6% |
| 12/9/2017 | Atlantic 10 | Dayton | 70 | Penn | 78 | 13350 | University of Dayton Arena | 13435 | 99.4% |
| 12/5/2017 | SEC | Arkansas | 92 | Colorado State | 66 | 13634 | Bud Walton Arena | 20320 | 67.1% |
| 12/10/2017 | Big Ten | Purdue | 86 | IUPUI | 61 | 13641 | Mackey Arena | 14846 | 91.9% |
| 12/5/2017 | Big Ten | Nebraska | 78 | Minnesota | 68 | 13847 | Pinnacle Bank Arena | 15147 | 91.4% |
| 12/4/2017 | Big 12 | Iowa State | 94 | N Illinois | 80 | 13894 | Hilton Coliseum | 14356 | 96.8% |
| 12/9/2017 | SEC | Tennessee | 81 | Lipscomb | 71 | 14051 | Thompson-Boling Arena | 21678 | 64.8% |
| 12/10/2017 | Big 12 | Iowa State | 78 | Alcorn State | 58 | 14112 | Hilton Coliseum | 14356 | 98.3% |
| 12/7/2017 | Big Ten | Purdue | 80 | Valparaiso | 50 | 14232 | Mackey Arena | 14846 | 95.9% |
| 12/7/2017 | Big 12 | Iowa State | 84 | Iowa | 78 | 14384 | Hilton Coliseum | 14356 | 100.2% |
| 12/9/2017 | Big Ten | Michigan State | 88 | Southern Utah | 63 | 14797 | Breslin Center | 16280 | 90.9% |
| 12/5/2017 | SEC | Missouri | 70 | Miami (OH) | 51 | 15061 | Mizzou Arena | 15061 | 100.0% |
| 12/5/2017 | Big East | Creighton | 111 | North Dakota | 68 | 15069 | CenturyLink Center Omaha | 17100 | 88.1% |
| 12/10/2017 | Big 12 | Kansas | 85 | Arizona State | 95 | 16300 | Allen Fieldhouse | 16300 | 100.0% |
| 12/6/2017 | Big 12 | Kansas | 65 | Washington | 74 | 17106 | Sprint Center | 18972 | 90.2% |
| 12/6/2017 | ACC | Louisville | 86 | Siena | 60 | 17215 | KFC Yum! Center | 22090 | 77.9% |
| 12/4/2017 | Big Ten | Indiana | 77 | Iowa | 64 | 17222 | Assembly Hall (Indiana) | 17472 | 98.6% |
| 12/9/2017 | Big Ten | Wisconsin | 63 | Marquette | 82 | 17287 | Kohl Center | 17230 | 100.3% |
| 12/9/2017 | SEC | Arkansas | 95 | Minnesota | 79 | 17583 | Bud Walton Arena | 20320 | 86.5% |
| 12/9/2017 | Big East | Creighton | 75 | Nebraska | 65 | 17901 | CenturyLink Center Omaha | 17100 | 104.7% |
| 12/9/2017 | ACC | Louisville | 71 | Indiana | 62 | 20030 | KFC Yum! Center | 22090 | 90.7% |
| 12/9/2017 | ACC | Syracuse | 72 | Colgate | 58 | 21380 | Carrier Dome | 35446 | 60.3% |