We’re back again this week, and with it a shocking new season low for Division 1 attendance. In fact, the number is so low it would be in the bottom 1% of college BASKETBALL attendance last year. So let’s take a look, shall we?
Worst overall Division 1 attendance last week: 471 – Jacksonville vs Drake on Saturday. Can you believe it? Fewer than 500 attended the game between the Dolphins and the Bulldogs, which Drake won in the last minutes 31-27, sending home scores of saddened Dolphins fans. To the credit of Jacksonville U, they could’ve probably inflated their numbers a bit by counting the players and support staff (the old, plus the stands don’t really look like they’re only at 10% of the 5,000 seat stadium’s capacity:
???? field goal gives Jacksonville a 13-0 lead with 6:16 till halftime #DUvsJU pic.twitter.com/qYnANOZDH0
— Drake Football (@DrakeBulldogsFB) November 5, 2016
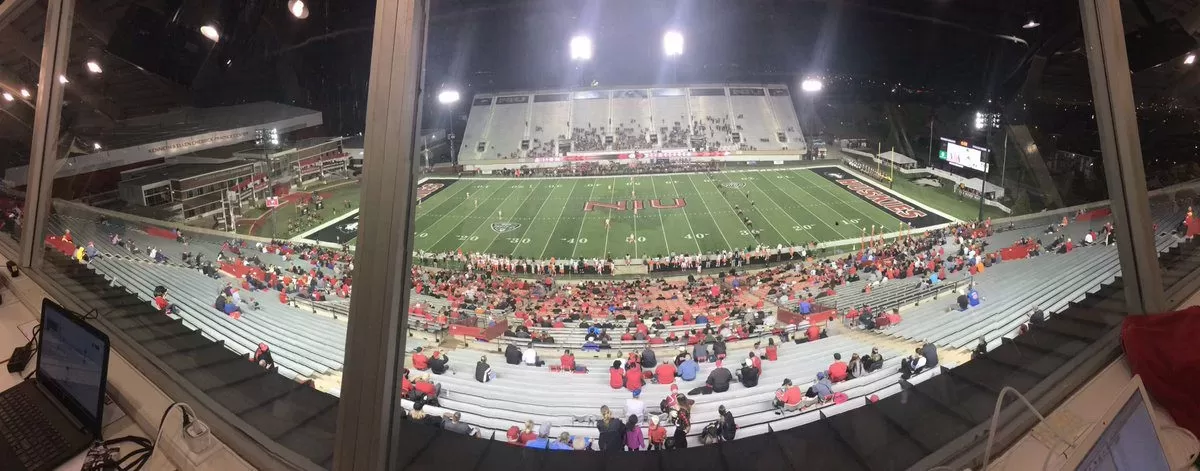
Worst overall FBS attendance last week: 4,790 – Northern Illinois vs Bowling Green. It’s hard not to give the Northern Illinois fans a pass on this one, as the MAC contest was held directly opposite to the Cubs-Indians World Series Game Six, which perhaps the people in the Northern Illinois area may have been inclined to watch. Either way, the recently expanded Huskie [sic] Stadium sat a hair above 10% full on Tuesday night for NIU’s 45-20 victory:

Worst overall Power Five attendance last week: 25,334 – Wake Forest vs Virginia. For the second straight week, Wake wins At 78% full, this is more of a function of Wake Forest’s size rather than a lack of fan interest. Deacon fans were treated to a 27-20 win over Virginia this week.
Emptiest FBS stadium as a percentage of capacity: Arkansas-Pine Bluff (8.4% full, 1,347 in attendance)
Emptiest FBS Power Five stadium as a percentage of capacity: Duke (66.5% full, 38,217 in attendance)
And now, for your browsing pleasure, every game and the corresponding attendance for this week. Enjoy!
| Date | Division | Conference | Home Team | Home Score | Away Team | Away Score | Attendance | Venue | Capacity | % Full |
|---|---|---|---|---|---|---|---|---|---|---|
| 11/5/2016 | FCS | Pioneer | Jacksonville | 27 | Drake | 31 | 471 | D.B. Milne Field | 5000 | 9.4% |
| 11/5/2016 | FCS | SWAC | AR-Pine Bluff | 7 | Miss Valley St | 41 | 1347 | Golden Lion Stadium | 16000 | 8.4% |
| 11/5/2016 | FCS | MEAC | Delaware State | 19 | NC Central | 38 | 1597 | Alumni Stadium (DE) | 7193 | 22.2% |
| 11/5/2016 | FCS | Patriot League | Georgetown | 20 | Holy Cross | 21 | 1710 | Multi-Sport Field | 2500 | 68.4% |
| 11/5/2016 | FCS | Northeast | Wagner | 20 | Duquesne | 28 | 2320 | Wagner College Stadium | 3500 | 66.3% |
| 11/5/2016 | FCS | Ohio Valley | E Illinois | 17 | UT Martin | 33 | 3054 | O’Brien Stadium | 10000 | 30.5% |
| 11/5/2016 | FCS | Big South | Presbyterian | 0 | Liberty | 16 | 3101 | Bailey Memorial Stadium | 6500 | 47.7% |
| 11/5/2016 | FCS | MEAC | Savannah State | 31 | Norfolk State | 14 | 3147 | T.A. Wright Stadium | 8500 | 37.0% |
| 11/5/2016 | FCS | Missouri Valley | Indiana State | 6 | Northern Iowa | 39 | 3409 | Memorial Stadium (Terre Haute, IN) | 12764 | 26.7% |
| 11/5/2016 | FCS | MEAC | Morgan State | 10 | Bethune-Cookman | 41 | 3521 | Hughes Stadium (MD) | 10000 | 35.2% |
| 11/5/2016 | FCS | Missouri Valley | W Illinois | 26 | Illinois State | 31 | 3589 | Hanson Field | 16368 | 21.9% |
| 11/5/2016 | FCS | Ivy League | Cornell | 13 | Dartmouth | 17 | 3783 | Schoellkopf Field | 25597 | 14.8% |
| 11/5/2016 | FCS | Southland | Abil Christian | 25 | Northwestern St | 22 | 3957 | Shotwell Stadium | 15075 | 26.2% |
| 11/5/2016 | FCS | Colonial Athletic | Towson | 23 | Elon | 6 | 4009 | Johnny Unitas Stadium | 11198 | 35.8% |
| 11/5/2016 | FCS | Pioneer | Stetson | 38 | Marist | 45 | 4032 | Spec Martin Stadium | 6000 | 67.2% |
| 11/5/2016 | FCS | Pioneer | Dayton | 37 | Valparaiso | 21 | 4193 | Welcome Stadium | 11000 | 38.1% |
| 11/5/2016 | FCS | Ohio Valley | E Kentucky | 28 | Murray State | 41 | 4200 | Roy Kidd Stadium | 20000 | 21.0% |
| 11/5/2016 | FCS | Patriot League | Fordham | 24 | Colgate | 20 | 4285 | Coffey Field | 7000 | 61.2% |
| 11/5/2016 | FCS | Big Sky | N Colorado | 13 | North Dakota | 23 | 4322 | Nottingham Field | 8533 | 50.7% |
| 11/5/2016 | FCS | Colonial Athletic | Albany | 17 | Delaware | 33 | 4412 | Bob Ford Field | 8500 | 51.9% |
| 11/5/2016 | FCS | Pioneer | Campbell | 28 | Davidson | 0 | 4644 | Barker-Lane Stadium | 5000 | 92.9% |
| 11/1/2016 | FBS | MAC | N Illinois | 45 | Bowling Green | 20 | 4790 | Huskie Stadium | 45995 | 10.4% |
| 11/5/2016 | FCS | Pioneer | Butler | 28 | Morehead State | 54 | 4896 | Butler Bowl | 7500 | 65.3% |
| 11/5/2016 | FCS | SWAC | PV A&M | 31 | Alcorn State | 27 | 5542 | Panther Stadium (TX) | 15000 | 36.9% |
| 11/1/2016 | FBS | MAC | Ball State | 20 | W Michigan | 52 | 5614 | Scheumann Stadium | 23861 | 23.5% |
| 11/5/2016 | FCS | Big Sky | UC Davis | 29 | Portland State | 51 | 5665 | Aggie Stadium (UC Davis) | 10743 | 52.7% |
| 11/5/2016 | FCS | Missouri Valley | S Illinois | 35 | South Dakota | 28 | 5689 | Saluki Stadium | 15000 | 37.9% |
| 11/5/2016 | FCS | Colonial Athletic | Stony Brook | 9 | William & Mary | 14 | 5732 | Kenneth P. LaValle Stadium | 12000 | 47.8% |
| 11/5/2016 | FCS | Southland | Incarnate Word | 10 | SE Louisiana | 30 | 5746 | Gayle and Tom Benson Stadium | 6000 | 95.8% |
| 11/5/2016 | FCS | Ohio Valley | Austin Peay | 40 | Tennessee St | 41 | 6041 | Governors Stadium | 10000 | 60.4% |
| 11/5/2016 | FCS | SWAC | Alabama A&M | 17 | Grambling St | 56 | 6278 | Louis Crews Stadium | 21000 | 29.9% |
| 11/2/2016 | FBS | MAC | Akron | 17 | Toledo | 48 | 6559 | InfoCision Stadium | 30000 | 21.9% |
| 11/5/2016 | FCS | Colonial Athletic | Maine | 7 | Villanova | 26 | 6790 | Alfond Stadium (ME) | 10000 | 67.9% |
| 11/5/2016 | FCS | Ohio Valley | SE Missouri St | 10 | Jacksonville St | 17 | 6839 | Houck Stadium | 11015 | 62.1% |
| 11/5/2016 | FCS | Big South | Kennesaw St | 56 | Clark Atlanta | 0 | 6916 | Fifth Third Bank Stadium | 8318 | 83.1% |
| 11/5/2016 | FCS | Patriot League | Lehigh | 20 | Bucknell | 13 | 7049 | Goodman Stadium | 16000 | 44.1% |
| 11/3/2016 | FCS | Southland | Nicholls | 35 | Lamar | 10 | 7121 | John L. Guidry Stadium | 10500 | 67.8% |
| 11/5/2016 | FCS | Independent | Coast Carolina | 38 | Monmouth | 17 | 7123 | Brooks Stadium | 9214 | 77.3% |
| 11/5/2016 | FCS | SWAC | Southern | 26 | Texas Southern | 10 | 7259 | A.W. Mumford Stadium | 28500 | 25.5% |
| 11/5/2016 | FCS | Big Sky | Southern Utah | 38 | Montana State | 21 | 7342 | Eccles Coliseum | 8500 | 86.4% |
| 11/5/2016 | FCS | Ivy League | Princeton | 28 | Penn | 0 | 7367 | Princeton Stadium | 27773 | 26.5% |
| 11/5/2016 | FCS | Southern | Furman | 27 | Wofford | 34 | 7834 | Paladin Stadium | 16000 | 49.0% |
| 11/5/2016 | FCS | Southland | Sam Houston | 56 | McNeese | 43 | 8025 | Bowers Stadium | 12593 | 63.7% |
| 11/5/2016 | FCS | Southern | W Carolina | 32 | VMI | 29 | 8225 | E.J. Whitmire Stadium | 13742 | 59.9% |
| 11/5/2016 | FCS | Colonial Athletic | Richmond | 43 | JMU | 47 | 8700 | Robins Stadium | 8700 | 100.0% |
| 11/5/2016 | FCS | Big Sky | Weber State | 20 | N Arizona | 33 | 8740 | Stewart Stadium | 17312 | 50.5% |
| 11/5/2016 | FCS | Big Sky | Cal Poly | 21 | E Washington | 42 | 9722 | Alex G. Spanos Stadium | 11075 | 87.8% |
| 11/5/2016 | FCS | Southland | SF Austin | 14 | Cent Arkansas | 34 | 10188 | Homer Bryce Stadium | 14575 | 69.9% |
| 11/5/2016 | FCS | Missouri Valley | South Dakota St | 49 | Missouri State | 24 | 10826 | Dana J. Dykhouse Stadium | 19340 | 56.0% |
| 11/5/2016 | FCS | Southern | Mercer | 21 | ETSU | 13 | 10913 | Moye Complex | 10200 | 107.0% |
| 11/5/2016 | FCS | Ivy League | Harvard | 28 | Columbia | 21 | 11233 | Harvard Stadium | 30323 | 37.0% |
| 11/5/2016 | FCS | MEAC | NC A&T | 30 | S Carolina St | 20 | 11357 | Aggie Stadium (NC) | 21500 | 52.8% |
| 11/3/2016 | FBS | Sun Belt | Georgia State | 16 | Arkansas State | 31 | 13363 | Georgia Dome | 28155 | 47.5% |
| 11/5/2016 | FBS | Conference USA | Mid Tennessee | 25 | UTSA | 45 | 13505 | Floyd Stadium | 30788 | 43.9% |
| 11/4/2016 | FBS | MAC | Miami (OH) | 37 | Cent Michigan | 17 | 14270 | Yager Stadium | 30087 | 47.4% |
| 11/5/2016 | FCS | Southern | The Citadel | 37 | Samford | 34 | 15015 | Johnson Hagood Stadium | 21000 | 71.5% |
| 11/5/2016 | FBS | Conference USA | W Kentucky | 49 | FIU | 21 | 15516 | L.T. Smith Stadium | 22000 | 70.5% |
| 11/5/2016 | FBS | Conference USA | UTEP | 42 | Houston Baptist | 10 | 15977 | Sun Bowl | 53415 | 29.9% |
| 11/5/2016 | FBS | Sun Belt | UL Monroe | 42 | South Alabama | 35 | 16073 | Malone Stadium | 30427 | 52.8% |
| 11/3/2016 | FBS | MAC | Ohio | 34 | Buffalo | 10 | 17113 | Peden Stadium | 24617 | 69.5% |
| 11/5/2016 | FBS | Mountain West | New Mexico | 35 | Nevada | 26 | 17290 | University Stadium (NM) | 39224 | 44.1% |
| 11/5/2016 | FBS | The American | Tulsa | 45 | East Carolina | 24 | 17557 | Chapman Stadium | 30000 | 58.5% |
| 11/5/2016 | FBS | Mountain West | Wyoming | 52 | Utah State | 28 | 17837 | War Memorial Stadium (WY) | 34745 | 51.3% |
| 11/5/2016 | FCS | Missouri Valley | North Dakota St | 24 | Youngstown St | 3 | 18332 | Fargodome | 19000 | 96.5% |
| 11/5/2016 | FBS | Conference USA | Rice | 25 | FAU | 42 | 19892 | Rice Stadium | 70000 | 28.4% |
| 11/5/2016 | FBS | Conference USA | Old Dominion | 38 | Marshall | 14 | 20118 | S.B. Ballard Stadium | 20118 | 100.0% |
| 11/5/2016 | FBS | Sun Belt | LA-Lafayette | 13 | Idaho | 23 | 21367 | Cajun Field | 41357 | 51.7% |
| 11/5/2016 | FBS | Conference USA | North Texas | 24 | LA Tech | 45 | 21643 | Apogee Stadium | 30850 | 70.2% |
| 11/5/2016 | FBS | Sun Belt | Troy | 52 | UMass | 31 | 21763 | Veterans Memorial Stadium (AL) | 30000 | 72.5% |
| 11/4/2016 | FBS | Big East | UConn | 0 | Temple | 21 | 22316 | Rentschler Field | 40000 | 55.8% |
| 11/5/2016 | FBS | Mountain West | Colorado State | 37 | Fresno State | 0 | 23187 | Hughes Stadium (CO) | 32500 | 71.3% |
| 11/5/2016 | FCS | Big Sky | Montana | 62 | Idaho State | 44 | 24027 | Washington Grizzly | 25217 | 95.3% |
| 11/5/2016 | FBS | The American | SMU | 7 | Memphis | 51 | 24379 | Gerald J. Ford Stadium | 35481 | 68.7% |
| 11/5/2016 | FBS | ACC | Wake Forest | 27 | Virginia | 20 | 25334 | BB&T Field | 32483 | 78.0% |
| 11/5/2016 | FBS | Conference USA | Southern Miss | 27 | Charlotte | 38 | 28347 | M. M. Roberts Stadium | 36000 | 78.7% |
| 11/5/2016 | FBS | Sun Belt | Appalachian St | 35 | Texas State | 10 | 28472 | Kidd Brewer Stadium | 24050 | 118.4% |
| 11/5/2016 | FBS | ACC | Boston College | 7 | Louisville | 52 | 30644 | Alumni Stadium (MA) | 44500 | 68.9% |
| 11/5/2016 | FBS | The American | UCF | 37 | Tulane | 6 | 31571 | Bright House Networks Stadium | 48453 | 65.2% |
| 11/4/2016 | FBS | Mountain West | Boise State | 45 | San Jose State | 31 | 31863 | Albertsons Stadium | 36387 | 87.6% |
| 11/5/2016 | FBS | Pac 12 | Washington St | 69 | Arizona | 7 | 33547 | Martin Stadium | 40306 | 83.2% |
| 11/5/2016 | FBS | Big Ten | Rutgers | 27 | Indiana | 33 | 37345 | High Point Solutions Stadium | 52454 | 71.2% |
| 11/5/2016 | FBS | The American | Cincinnati | 3 | BYU | 20 | 37522 | Nippert Stadium | 35105 | 106.9% |
| 11/5/2016 | FBS | ACC | Duke | 21 | Virginia Tech | 24 | 38217 | Wallace Wade Stadium | 57500 | 66.5% |
| 11/5/2016 | FBS | Independent | Army | 12 | Air Force | 31 | 38443 | Michie Stadium | 38000 | 101.2% |
| 11/5/2016 | FBS | Pac 12 | Stanford | 26 | Oregon State | 15 | 38813 | Stanford Stadium | 51607 | 75.2% |
| 11/5/2016 | FBS | Mountain West | San Diego State | 55 | Hawai’i | 0 | 41644 | Qualcomm Stadium | 70561 | 59.0% |
| 11/5/2016 | FBS | Big Ten | Northwestern | 7 | Wisconsin | 21 | 42016 | Ryan Field | 47130 | 89.1% |
| 11/5/2016 | FBS | Big Ten | Minnesota | 44 | Purdue | 31 | 42832 | TCF Bank Stadium | 50805 | 84.3% |
| 11/3/2016 | FBS | Pac 12 | Colorado | 20 | UCLA | 10 | 43761 | Folsom Field | 54972 | 79.6% |
| 11/5/2016 | FBS | Big Ten | Illinois | 31 | Michigan State | 27 | 47144 | Memorial Stadium (Champaign, IL) | 60670 | 77.7% |
| 11/5/2016 | FBS | Pac 12 | Cal | 27 | Washington | 66 | 47756 | Memorial Stadium (Berkeley, CA) | 62467 | 76.4% |
| 11/5/2016 | FBS | Big 12 | Baylor | 22 | TCU | 62 | 48129 | McLane Stadium | 45140 | 106.6% |
| 11/3/2016 | FBS | Big 12 | Iowa State | 24 | Oklahoma | 34 | 50662 | Jack Trice Stadium | 56795 | 89.2% |
| 11/5/2016 | FBS | The American | Navy | 28 | Notre Dame | 27 | 50867 | EverBank Field | 82000 | 62.0% |
| 11/5/2016 | FBS | ACC | Miami | 51 | Pitt | 28 | 51796 | Hard Rock Stadium | 65326 | 79.3% |
| 11/5/2016 | FBS | Big 12 | Kansas State | 37 | Oklahoma State | 43 | 52450 | Bill Snyder Family Stadium | 53000 | 99.0% |
| 11/5/2016 | FBS | Big 12 | West Virginia | 48 | Kansas | 21 | 56343 | Milan Puskar Stadium | 60000 | 93.9% |
| 11/5/2016 | FBS | ACC | NC State | 20 | Florida State | 24 | 57789 | Carter-Finley Stadium | 57583 | 100.4% |
| 11/5/2016 | FBS | ACC | North Carolina | 48 | Georgia Tech | 20 | 58000 | Kenan Stadium | 63000 | 92.1% |
| 11/5/2016 | FBS | SEC | Miss St | 35 | Texas A&M | 28 | 58407 | Davis Wade Stadium | 58103 | 100.5% |
| 11/5/2016 | FBS | SEC | Ole Miss | 37 | Ga Southern | 27 | 60263 | Vaught-Hemingway Stadium | 62657 | 96.2% |
| 11/5/2016 | FBS | Big 12 | Texas Tech | 37 | Texas | 45 | 60803 | Jones AT&T Stadium | 60454 | 100.6% |
| 11/5/2016 | FBS | SEC | Kentucky | 24 | Georgia | 27 | 62507 | Commonwealth Stadium | 71024 | 88.0% |
| 11/5/2016 | FBS | SEC | South Carolina | 31 | Missouri | 21 | 73817 | Williams-Brice Stadium | 80250 | 92.0% |
| 11/5/2016 | FBS | SEC | Arkansas | 31 | Florida | 10 | 74432 | Razorback Stadium | 72000 | 103.4% |
| 11/5/2016 | FBS | Pac 12 | USC | 45 | Oregon | 20 | 74625 | Los Angeles Memorial Coliseum | 93607 | 79.7% |
| 11/5/2016 | FBS | ACC | Clemson | 54 | Syracuse | 0 | 80609 | Memorial Stadium (Clemson, SC) | 81500 | 98.9% |
| 11/5/2016 | FBS | SEC | Auburn | 23 | Vanderbilt | 16 | 87451 | Jordan-Hare Stadium | 87451 | 100.0% |
| 11/5/2016 | FBS | SEC | Tennessee | 55 | Tenn Tech | 0 | 98343 | Neyland Stadium | 102455 | 96.0% |
| 11/5/2016 | FBS | SEC | LSU | 0 | Alabama | 10 | 102321 | Tiger Stadium (LA) | 102321 | 100.0% |
| 11/5/2016 | FBS | Big Ten | Penn State | 41 | Iowa | 14 | 106194 | Beaver Stadium | 106572 | 99.6% |
| 11/5/2016 | FBS | Big Ten | Ohio State | 62 | Nebraska | 3 | 108750 | Ohio Stadium | 104944 | 103.6% |
| 11/5/2016 | FBS | Big Ten | Michigan | 59 | Maryland | 3 | 110626 | Michigan Stadium | 107601 | 102.8% |