
Attendance, for the most part, has steadied out through February, as school is in session, and weather has been fairly consistent, preventing low attendances across college basketball. This week, the numbers were up around 3% over last week, and the lowest attended game still had over 300 people, which should drop off as we get closer to the end of the season when fans decide to truly mail it in.
Number of games drawing fewer than 1,000 fans: 34
Here are the 3 lowest attended games of last week:
3. Bryant vs Sacred Heart – Bryant isn’t even good enough to make their own conference tournament. Their season will end on the 27th against LIU-Brooklyn, and the only people who may care will be the 431 who showed up to see the Bulldogs get stomped 74-57 by the Sacred Heart Pioneers. In fact, this is Bryant’s third time on the list, so congratulations to Bulldogs fans!
2. McNeese State vs SE Louisiana – I’ve already beaten the “Worst Looking Arena in College Basketball” so McNeese State needs to stop making this list. Only 350 showed up to see the two below average Southland teams battle it out. Southeast Louisiana took it home 79-76, leaving the poor Lake Charles residents on the wrong side of the intrastate battle with their Hammond counterparts. I have no doubt it was a joyful ride home on I-10 for the SE Louisiana Lions fans. An action shot:
#SLCMBB: Triple by @McNeeseSports Harvey. One point game vs. @sluathletics with 27 seconds to go @liveonasn. pic.twitter.com/2z5jtYguGS
— Southland Conference (@SouthlandSports) February 16, 2016
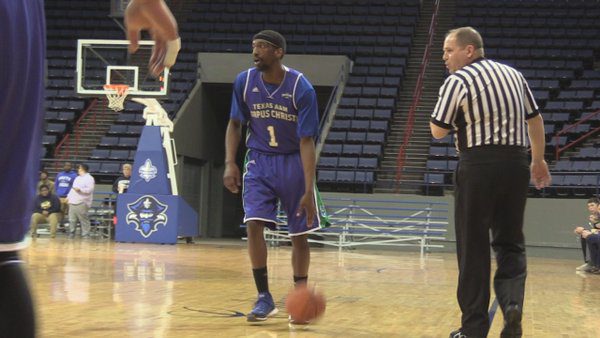
1. New Orleans vs Texas A&M – Corpus Christi – And finally, elsewhere in the Southland: The New Orleans Privateers hosted the Texas A&M – Corpus Christi Islanders (Some say the school is a little TACCI.1). Despite that TAMU-CC (Seriously, their damn abbreviation is 50% longer than Iona or Yale’s full names) is sitting only a handful of games behind Stephen F. Austin for the Southland lead, a mere 332 showed up to see the eventual Southland 2 seed win 65-57. Even with terrible basketball and no chance of a postseason for either team, 332 dedicated folks in the Crescent City. Good for them. And of course, your action shot of the week!
And now, as always, the miscellany:
Biggest group of people to see a loss at home this week: Syracuse (vs Pitt) 28,696.
Smallest group of people to see a win at home this week: St. Peter’s (vs Manhattan), 473.
Smallest Power Conference attendance: Washington State (vs Stanford), 2,711.
Smallest Power Conference home win attendance: Missouri (vs South Carolina), 5,017.
Average attendance this week: 4,975, up 159 (3.3%) over last week.
And as always, your full attendance numbers for the week:
| Date | Conference | Home Team | Home Score | Away Team | Away Score | Attendance | Venue | Capacity | % full |
|---|---|---|---|---|---|---|---|---|---|
| 2/15/2016 | Southland | New Orleans | 57 | Texas A&M-CC | 65 | 332 | Lakefront Arena | 10000 | 3.32% |
| 2/15/2016 | Southland | McNeese State | 76 | SE Louisiana | 79 | 350 | Burton Coliseum | 6500 | 5.38% |
| 2/18/2016 | Northeast | Bryant | 57 | Sacred Heart | 74 | 431 | Chace Athletic Center | 2700 | 15.96% |
| 2/17/2016 | MAAC | St Peter’s | 70 | Manhattan | 69 | 473 | Yanitelli Center | 3200 | 14.78% |
| 2/20/2016 | Southland | Nicholls State | 53 | SF Austin | 88 | 522 | Stopher Gymnasium | 3800 | 13.74% |
| 2/15/2016 | MEAC | Coppin State | 67 | Delaware State | 71 | 533 | Physical Education Complex | 4100 | 13.00% |
| 2/20/2016 | Northeast | Bryant | 53 | Mt St Mary’s | 71 | 580 | Chace Athletic Center | 2700 | 21.48% |
| 2/15/2016 | SWAC | Southern | 97 | Miss Valley St | 64 | 599 | F. G. Clark Activity Center | 7500 | 7.99% |
| 2/18/2016 | Big South | Presbyterian | 61 | UNC Asheville | 70 | 606 | Ross E. Templeton P.E. Center | 2300 | 26.35% |
| 2/18/2016 | Atlantic Sun | Jacksonville | 81 | USC Upstate | 76 | 628 | Jacksonville Veterans Memorial | 14091 | 4.46% |
| 2/20/2016 | Big Sky | Portland State | 107 | E Washington | 91 | 633 | Stott Center | 1500 | 42.20% |
| 2/18/2016 | Big Sky | Sacramento St | 88 | E Washington | 93 | 649 | The Nest | 900 | 72.11% |
| 2/18/2016 | Big West | UC Riverside | 55 | UCSB | 65 | 665 | SRC Arena | 3168 | 20.99% |
| 2/17/2016 | Patriot League | American U | 60 | Lafayette | 59 | 675 | Bender Arena | 4500 | 15.00% |
| 2/15/2016 | SWAC | PV A&M | 66 | Jackson State | 80 | 687 | William Nicks Building | 6500 | 10.57% |
| 2/15/2016 | Southland | Houston Baptist | 79 | Lamar | 78 | 703 | Sharp Gymnasium | 1500 | 46.87% |
| 2/17/2016 | Patriot League | Boston U | 71 | Colgate | 68 | 705 | Case Gym | 1800 | 39.17% |
| 2/15/2016 | Patriot League | Lehigh | 64 | Holy Cross | 59 | 710 | Stabler Arena | 6000 | 11.83% |
| 2/15/2016 | Southland | Cent Arkansas | 107 | Northwestern St | 94 | 715 | Farris Center | 6000 | 11.92% |
| 2/18/2016 | Atlantic Sun | Stetson | 82 | Kennesaw St | 92 | 722 | Edmunds Center | 5000 | 14.44% |
| 2/20/2016 | SWAC | Grambling St | 58 | Jackson State | 61 | 749 | Fredrick C. Hobdy Assembly Center | 7500 | 9.99% |
| 2/20/2016 | Atlantic Sun | Stetson | 74 | Lipscomb | 77 | 761 | Edmunds Center | 5000 | 15.22% |
| 2/20/2016 | SWAC | AR-Pine Bluff | 55 | PV A&M | 57 | 798 | H. O. Clemmons Arena | 4500 | 17.73% |
| 2/15/2016 | MEAC | NC A&T | 77 | Bethune-Cookman | 83 | 823 | Corbett Sports Center | 5700 | 14.44% |
| 2/15/2016 | Northeast | St Francis (BKN) | 67 | LIU Brooklyn | 82 | 825 | Pope Physical Education Center | 2000 | 41.25% |
| 2/18/2016 | Southland | Houston Baptist | 73 | Abil Christian | 71 | 827 | Sharp Gymnasium | 1500 | 55.13% |
| 2/20/2016 | Big Sky | Sacramento St | 68 | Idaho | 65 | 845 | The Nest | 900 | 93.89% |
| 2/17/2016 | America East | UNH | 80 | UMass Lowell | 69 | 882 | Lundholm Gymnasium | 6501 | 13.57% |
| 2/20/2016 | SWAC | Miss Valley St | 67 | Texas Southern | 98 | 898 | Leflore County Civic Center | 1801 | 49.86% |
| 2/18/2016 | Big Sky | Portland State | 74 | Idaho | 80 | 920 | Stott Center | 1500 | 61.33% |
| 2/21/2016 | Patriot League | Colgate | 93 | Loyola (MD) | 90 | 943 | Cotterell Court | 3000 | 31.43% |
| 2/18/2016 | Northeast | Robert Morris | 74 | LIU Brooklyn | 67 | 952 | Charles L. Sewall Center | 3056 | 31.15% |
| 2/15/2016 | MAAC | Fairfield | 76 | Marist | 73 | 956 | Webster Bank Arena | 10000 | 9.56% |
| 2/18/2016 | Colonial Athletic | Drexel | 76 | Elon | 81 | 976 | Daskalakis Athletic Center | 2532 | 38.55% |
| 2/20/2016 | Atlantic Sun | Jacksonville | 58 | NJIT | 73 | 1003 | Jacksonville Veterans Memorial | 14091 | 7.12% |
| 2/21/2016 | MAAC | St Peter’s | 75 | Monmouth | 82 | 1013 | Yanitelli Center | 3200 | 31.66% |
| 2/18/2016 | Southern | Samford | 77 | UNCG | 82 | 1021 | Pete Hanna Center | 4974 | 20.53% |
| 2/17/2016 | Summit League | IUPUI | 88 | Omaha | 76 | 1044 | Indiana Farmers Coliseum | 6500 | 16.06% |
| 2/17/2016 | Patriot League | Navy | 74 | Lehigh | 77 | 1068 | Alumni Hall | 5710 | 18.70% |
| 2/15/2016 | Southland | Abil Christian | 71 | Sam Houston | 84 | 1075 | Mabee Athletic Complex | 2400 | 44.79% |
| 2/18/2016 | MAAC | Quinnipiac | 56 | St Peter’s | 55 | 1075 | TD Bank Sports Center | 3570 | 30.11% |
| 2/17/2016 | Patriot League | Army | 72 | Holy Cross | 68 | 1086 | Christl Arena | 5043 | 21.53% |
| 2/19/2016 | Ivy League | Cornell | 66 | Dartmouth | 78 | 1098 | Newman Arena | 4473 | 24.55% |
| 2/20/2016 | MEAC | Morgan State | 59 | NC Central | 73 | 1104 | Hill Field House | 4250 | 25.98% |
| 2/18/2016 | Northeast | Fair Dickinson | 74 | Wagner | 94 | 1116 | Rothman Center | 5000 | 22.32% |
| 2/16/2016 | Big South | Campbell | 110 | Allen | 66 | 1135 | Pope Convocation Center | 3095 | 36.67% |
| 2/18/2016 | MAAC | Canisius | 71 | Fairfield | 74 | 1137 | Koessler Athletic Center | 2176 | 52.25% |
| 2/16/2016 | MAC | N Illinois | 71 | Bowling Green | 60 | 1148 | NIU Convocation Center | 10000 | 11.48% |
| 2/17/2016 | America East | Hartford | 88 | UMBC | 65 | 1154 | Chase Arena | 4107 | 28.10% |
| 2/16/2016 | Horizon League | Youngstown St | 92 | UIC | 91 | 1162 | Beeghly Center | 6500 | 17.88% |
| 2/18/2016 | MAAC | Niagara | 76 | Marist | 72 | 1163 | Gallagher Center | 2400 | 48.46% |
| 2/20/2016 | Summit League | W Illinois | 67 | South Dakota St | 87 | 1166 | Western Hall | 5139 | 22.69% |
| 2/20/2016 | MEAC | Howard | 56 | Savannah State | 66 | 1205 | Burr Gymnasium | 2700 | 44.63% |
| 2/17/2016 | Big West | CS Fullerton | 77 | UC Irvine | 96 | 1209 | Titan Gym | 5015 | 24.11% |
| 2/15/2016 | SWAC | Alcorn State | 79 | AR-Pine Bluff | 60 | 1213 | Davey Whitney Complex | 7000 | 17.33% |
| 2/18/2016 | Big South | Longwood | 80 | High Point | 88 | 1218 | Willett Hall | 2522 | 48.30% |
| 2/20/2016 | Northeast | Fair Dickinson | 86 | Sacred Heart | 91 | 1228 | Rothman Center | 5000 | 24.56% |
| 2/20/2016 | SWAC | Alabama A&M | 58 | Alcorn State | 62 | 1237 | T.M. Elmore Gymnasium | 6000 | 20.62% |
| 2/20/2016 | Conference USA | UTSA | 74 | Southern Miss | 53 | 1250 | UTSA Convocation Center | 4080 | 30.64% |
| 2/18/2016 | Sun Belt | Appalachian St | 71 | South Alabama | 75 | 1253 | Holmes Convocation Center | 8325 | 15.05% |
| 2/18/2016 | Conference USA | UTSA | 74 | LA Tech | 87 | 1258 | UTSA Convocation Center | 4080 | 30.83% |
| 2/20/2016 | MAAC | Niagara | 59 | Fairfield | 71 | 1270 | Gallagher Center | 2400 | 52.92% |
| 2/21/2016 | America East | Maine | 56 | Stony Brook | 75 | 1285 | Cross Insurance Center | 5800 | 22.16% |
| 2/20/2016 | Western Athletic | UT Rio Grande | 57 | CSU Bakersfield | 70 | 1299 | UTRGV Fieldhouse | 2500 | 51.96% |
| 2/20/2016 | MAAC | Canisius | 81 | Marist | 66 | 1318 | Koessler Athletic Center | 2176 | 60.57% |
| 2/20/2016 | SWAC | Alabama State | 77 | Southern | 68 | 1324 | Dunn-Oliver Acadome | 7400 | 17.89% |
| 2/17/2016 | Atlantic 10 | La Salle | 71 | St Bonaventure | 64 | 1329 | Tom Gola Arena | 4000 | 33.23% |
| 2/20/2016 | Southern | Samford | 73 | VMI | 67 | 1332 | Pete Hanna Center | 4974 | 26.78% |
| 2/18/2016 | Northeast | St Francis (PA) | 58 | St Francis (BKN) | 70 | 1381 | DeGol Arena | 3500 | 39.46% |
| 2/18/2016 | Big South | Gardner-Webb | 84 | Charleston So | 76 | 1383 | Paul Porter Arena | 5000 | 27.66% |
| 2/18/2016 | Southern | The Citadel | 51 | ETSU | 67 | 1389 | McAlister Field House | 6000 | 23.15% |
| 2/20/2016 | America East | UMBC | 54 | Vermont | 99 | 1389 | Retriever Activities Center | 4024 | 34.52% |
| 2/18/2016 | Conference USA | Rice | 90 | FAU | 85 | 1400 | Tudor Fieldhouse | 5750 | 24.35% |
| 2/20/2016 | Southland | McNeese State | 76 | Lamar | 87 | 1403 | Burton Coliseum | 6500 | 21.58% |
| 2/15/2016 | MAAC | Iona | 78 | Quinnipiac | 59 | 1421 | Hynes Athletics Center | 2611 | 54.42% |
| 2/20/2016 | Southland | Texas A&M-CC | 90 | Incarnate Word | 69 | 1422 | American Bank Center | 10000 | 14.22% |
| 2/15/2016 | SWAC | Texas Southern | 79 | Grambling St | 72 | 1426 | H&PE Arena | 8100 | 17.60% |
| 2/18/2016 | Western Athletic | UT Rio Grande | 67 | Seattle | 57 | 1435 | UTRGV Fieldhouse | 2500 | 57.40% |
| 2/16/2016 | Mountain West | Air Force | 79 | UNLV | 74 | 1445 | Clune Arena | 5858 | 24.67% |
| 2/18/2016 | West Coast | Pepperdine | 72 | San Francisco | 82 | 1449 | Firestone Fieldhouse | 4500 | 32.20% |
| 2/18/2016 | Summit League | IPFW | 91 | South Dakota St | 79 | 1452 | Allen County War Memorial Coliseum | 13000 | 11.17% |
| 2/20/2016 | Conference USA | North Texas | 70 | FAU | 62 | 1466 | UNT Coliseum | 10040 | 14.60% |
| 2/20/2016 | Sun Belt | Georgia State | 69 | Arkansas State | 61 | 1468 | GSU Sports Arena | 4500 | 32.62% |
| 2/15/2016 | MEAC | NC Central | 79 | Florida A&M | 74 | 1478 | McDougald-McLendon Gymnasium | 3056 | 48.36% |
| 2/17/2016 | Summit League | South Dakota | 82 | York | 55 | 1480 | The DakotaDome | 10000 | 14.80% |
| 2/18/2016 | Sun Belt | Georgia State | 49 | AR-Little Rock | 57 | 1516 | GSU Sports Arena | 4500 | 33.69% |
| 2/17/2016 | Atlantic 10 | Duquesne | 74 | G Washington | 81 | 1520 | A.J. Palumbo Center | 4406 | 34.50% |
| 2/20/2016 | Northeast | St Francis (PA) | 89 | LIU Brooklyn | 94 | 1531 | DeGol Arena | 3500 | 43.74% |
| 2/16/2016 | Horizon League | Cleveland State | 43 | Valparaiso | 66 | 1545 | Quicken Loans Arena | 20562 | 7.51% |
| 2/17/2016 | Mountain West | San Jose State | 55 | Nevada | 61 | 1560 | Event Center (San Jose St.) | 5000 | 31.20% |
| 2/20/2016 | Big Sky | Southern Utah | 71 | Idaho State | 89 | 1568 | Centrum Arena | 5300 | 29.58% |
| 2/17/2016 | The American | Tulane | 69 | Houston | 82 | 1593 | Devlin Fieldhouse | 3600 | 44.25% |
| 2/20/2016 | MAC | E Michigan | 91 | Toledo | 85 | 1636 | Convocation Center (MI) | 8824 | 18.54% |
| 2/21/2016 | Summit League | South Dakota | 71 | Denver | 76 | 1644 | The DakotaDome | 10000 | 16.44% |
| 2/19/2016 | MAAC | Rider | 64 | Siena | 84 | 1650 | Alumni Gymnasium (Rider) | 1650 | 100.00% |
| 2/18/2016 | Big West | CS Northridge | 63 | Hawaii | 69 | 1683 | Matadome | 3106 | 54.19% |
| 2/17/2016 | Missouri Valley | Loyola (CHI) | 59 | Northern Iowa | 56 | 1690 | Joseph J. Gentile Center | 4486 | 37.67% |
| 2/20/2016 | Sun Belt | Ga Southern | 61 | AR-Little Rock | 75 | 1702 | W. S. Hanner Fieldhouse | 4325 | 39.35% |
| 2/18/2016 | Ohio Valley | SE Missouri St | 69 | SIU ED | 72 | 1705 | Show Me Center | 6972 | 24.45% |
| 2/16/2016 | MAC | Miami (OH) | 56 | Ball State | 73 | 1706 | Millett Hall | 6400 | 26.66% |
| 2/18/2016 | Ohio Valley | UT Martin | 87 | E Illinois | 84 | 1709 | Skyhawk Arena | 5000 | 34.18% |
| 2/18/2016 | Colonial Athletic | Delaware | 62 | Charleston | 59 | 1831 | Bob Carpenter Center | 5000 | 36.62% |
| 2/20/2016 | Summit League | IPFW | 94 | Omaha | 90 | 1832 | Allen County War Memorial Coliseum | 13000 | 14.09% |
| 2/20/2016 | MEAC | Delaware State | 67 | Norfolk State | 64 | 1846 | Memorial Hall (Dover, DE) | 3000 | 61.53% |
| 2/18/2016 | Sun Belt | Ga Southern | 90 | Arkansas State | 59 | 1849 | W. S. Hanner Fieldhouse | 4325 | 42.75% |
| 2/20/2016 | Big South | Gardner-Webb | 81 | Longwood | 71 | 1854 | Paul Porter Arena | 5000 | 37.08% |
| 2/21/2016 | Patriot League | Holy Cross | 70 | American U | 71 | 1909 | Hart Center | 3600 | 53.03% |
| 2/20/2016 | Big South | Winthrop | 81 | UNC Asheville | 80 | 1919 | Winthrop Coliseum | 6100 | 31.46% |
| 2/20/2016 | Southland | Northwestern St | 99 | New Orleans | 102 | 1928 | Prather Coliseum | 3900 | 49.44% |
| 2/20/2016 | Ivy League | Cornell | 74 | Harvard | 76 | 1938 | Newman Arena | 4473 | 43.33% |
| 2/21/2016 | Patriot League | Lehigh | 73 | Lafayette | 61 | 1949 | Stabler Arena | 6000 | 32.48% |
| 2/18/2016 | Colonial Athletic | Hofstra | 84 | Towson | 82 | 1958 | Mack Sports Complex | 5124 | 38.21% |
| 2/20/2016 | West Coast | Pepperdine | 88 | Santa Clara | 76 | 1977 | Firestone Fieldhouse | 4500 | 43.93% |
| 2/17/2016 | America East | Vermont | 78 | Binghamton | 64 | 1989 | Patrick Gymnasium | 3228 | 61.62% |
| 2/18/2016 | Sun Belt | UT-Arlington | 84 | LA-Lafayette | 83 | 2010 | College Park Center | 7000 | 28.71% |
| 2/18/2016 | Big Sky | Southern Utah | 83 | Weber State | 87 | 2028 | Centrum Arena | 5300 | 38.26% |
| 2/15/2016 | #N/A | UNCG | 65 | Wofford | 61 | 2035 | Greensboro Coliseum | 21273 | 9.57% |
| 2/20/2016 | Sun Belt | Appalachian St | 78 | Troy | 74 | 2069 | Holmes Convocation Center | 8325 | 24.85% |
| 2/20/2016 | Sun Belt | Texas State | 61 | LA-Lafayette | 57 | 2104 | Strahan Coliseum | 7200 | 29.22% |
| 2/18/2016 | Western Athletic | Utah Valley | 74 | Chicago State | 72 | 2115 | UCCU Center | 8500 | 24.88% |
| 2/20/2016 | Big West | UCSB | 62 | UC Davis | 55 | 2116 | The Thunderdome | 6512 | 32.49% |
| 2/16/2016 | MAC | Cent Michigan | 77 | Toledo | 69 | 2139 | McGuirk Arena | 5300 | 40.36% |
| 2/20/2016 | Southland | Sam Houston | 105 | Cent Arkansas | 75 | 2139 | Bernard G. Johnson Coliseum | 6110 | 35.01% |
| 2/20/2016 | Ohio Valley | SE Missouri St | 68 | E Illinois | 71 | 2142 | Show Me Center | 6972 | 30.72% |
| 2/18/2016 | Big South | Winthrop | 79 | Coast Carolina | 67 | 2151 | Winthrop Coliseum | 6100 | 35.26% |
| 2/20/2016 | Big West | Cal Poly | 71 | CS Northridge | 75 | 2216 | Mott Athletics Center | 3032 | 73.09% |
| 2/17/2016 | Summit League | North Dakota St | 63 | W Illinois | 54 | 2227 | Scheels Arena | 6000 | 37.12% |
| 2/20/2016 | Northeast | Robert Morris | 72 | St Francis (BKN) | 82 | 2284 | Charles L. Sewall Center | 3056 | 74.74% |
| 2/20/2016 | Big South | Radford | 72 | High Point | 75 | 2331 | Donald N. Dedmon Center | 3205 | 72.73% |
| 2/17/2016 | Atlantic 10 | Fordham | 76 | UMass | 66 | 2341 | Rose Hill Gymnasium | 3470 | 67.46% |
| 2/20/2016 | Ohio Valley | Tennessee St | 61 | Jacksonville St | 46 | 2341 | Gentry Center | 10500 | 22.30% |
| 2/20/2016 | Ivy League | Columbia | 73 | Dartmouth | 54 | 2349 | Levien Gymnasium | 3408 | 68.93% |
| 2/16/2016 | Horizon League | N Kentucky | 68 | Detroit | 74 | 2357 | The Bank of Kentucky Center | 9400 | 25.07% |
| 2/18/2016 | Big West | Cal Poly | 58 | UC Davis | 53 | 2363 | Mott Athletics Center | 3032 | 77.94% |
| 2/20/2016 | Big Sky | North Dakota | 74 | N Colorado | 73 | 2424 | Betty Engelstad Sioux Center | 3300 | 73.45% |
| 2/18/2016 | Sun Belt | Texas State | 57 | UL Monroe | 76 | 2452 | Strahan Coliseum | 7200 | 34.06% |
| 2/21/2016 | MAAC | Quinnipiac | 59 | Manhattan | 63 | 2466 | TD Bank Sports Center | 3570 | 69.08% |
| 2/20/2016 | Ohio Valley | UT Martin | 68 | SIU ED | 51 | 2471 | Skyhawk Arena | 5000 | 49.42% |
| 2/17/2016 | Patriot League | Bucknell | 87 | Loyola (MD) | 52 | 2493 | Sojka Pavilion | 4000 | 62.33% |
| 2/16/2016 | Ohio Valley | Morehead State | 105 | St. Catharine | 66 | 2511 | Ellis T. Johnson Arena | 6500 | 38.63% |
| 2/19/2016 | Ivy League | Columbia | 90 | Harvard | 76 | 2587 | Levien Gymnasium | 3408 | 75.91% |
| 2/18/2016 | Atlantic Sun | North Florida | 107 | NJIT | 71 | 2611 | UNF Arena | 5800 | 45.02% |
| 2/20/2016 | Horizon League | Milwaukee | 88 | Cleveland State | 54 | 2689 | UW-Milwaukee Panther Arena | 12700 | 21.17% |
| 2/18/2016 | Pac 12 | Washington St | 56 | Stanford | 72 | 2711 | Friel Court | 12058 | 22.48% |
| 2/20/2016 | Colonial Athletic | Towson | 67 | Elon | 56 | 2736 | SECU Arena | 5250 | 52.11% |
| 2/15/2016 | Southern | ETSU | 83 | W Carolina | 77 | 2752 | Freedom Hall Civic Center | 5619 | 48.98% |
| 2/20/2016 | Ivy League | Princeton | 77 | Brown | 66 | 2772 | Jadwin Gymnasium | 6854 | 40.44% |
| 2/17/2016 | Missouri Valley | Drake | 74 | Evansville | 80 | 2790 | The Knapp Center | 7152 | 39.01% |
| 2/18/2016 | Ohio Valley | Morehead State | 66 | Tennessee St | 61 | 2800 | Ellis T. Johnson Arena | 6500 | 43.08% |
| 2/18/2016 | Big South | Liberty | 67 | Radford | 69 | 2802 | Vines Center | 8085 | 34.66% |
| 2/18/2016 | West Coast | Portland | 72 | Saint Mary’s | 74 | 2868 | Chiles Center | 4852 | 59.11% |
| 2/20/2016 | America East | Binghamton | 81 | UMass Lowell | 77 | 2884 | Events Center (Binghamton) | 5142 | 56.09% |
| 2/21/2016 | Horizon League | UIC | 63 | Oakland | 74 | 2888 | UIC Pavilion | 6958 | 41.51% |
| 2/15/2016 | Southland | SF Austin | 84 | Incarnate Word | 46 | 2892 | William R. Johnson Coliseum | 7203 | 40.15% |
| 2/20/2016 | Western Athletic | Utah Valley | 79 | UMKC | 70 | 2981 | UCCU Center | 8500 | 35.07% |
| 2/21/2016 | Atlantic 10 | G Washington | 90 | La Salle | 50 | 3002 | Charles E. Smith Center | 4338 | 69.20% |
| 2/17/2016 | Atlantic 10 | George Mason | 77 | Saint Louis | 79 | 3015 | EagleBank Arena | 10000 | 30.15% |
| 2/16/2016 | Sun Belt | South Alabama | 54 | Troy | 61 | 3027 | Mitchell Center | 10041 | 30.15% |
| 2/21/2016 | Colonial Athletic | Hofstra | 65 | Northeastern | 60 | 3030 | Mack Sports Complex | 5124 | 59.13% |
| 2/16/2016 | MAC | Kent State | 85 | W Michigan | 78 | 3035 | MAC Center | 6327 | 47.97% |
| 2/15/2016 | MAAC | Monmouth | 79 | Manhattan | 70 | 3040 | Multipurpose Activity Center | 4100 | 74.15% |
| 2/21/2016 | Patriot League | Bucknell | 80 | Boston U | 59 | 3044 | Sojka Pavilion | 4000 | 76.10% |
| 2/18/2016 | West Coast | San Diego | 67 | BYU | 69 | 3056 | Jenny Craig Pavilion | 5100 | 59.92% |
| 2/16/2016 | MAC | Akron | 80 | Buffalo | 70 | 3069 | James A. Rhodes Arena | 5500 | 55.80% |
| 2/20/2016 | West Coast | Portland | 80 | Pacific | 67 | 3103 | Chiles Center | 4852 | 63.95% |
| 2/20/2016 | Southern | Wofford | 77 | Furman | 73 | 3120 | Benjamin Johnson Arena | 3500 | 89.14% |
| 2/18/2016 | Colonial Athletic | William & Mary | 87 | UNC Wilmington | 69 | 3148 | Kaplan Arena | 8600 | 36.60% |
| 2/18/2016 | Colonial Athletic | JMU | 94 | Northeastern | 95 | 3152 | JMU Convocation Center | 7156 | 44.05% |
| 2/18/2016 | Conference USA | W Kentucky | 56 | Old Dominion | 59 | 3182 | E. A. Diddle Arena | 7326 | 43.43% |
| 2/21/2016 | Pac 12 | Washington St | 62 | Cal | 80 | 3203 | Friel Court | 12058 | 26.56% |
| 2/20/2016 | Ivy League | Penn | 58 | Yale | 79 | 3246 | Palestra | 8722 | 37.22% |
| 2/20/2016 | Sun Belt | UT-Arlington | 61 | UL Monroe | 64 | 3314 | College Park Center | 7000 | 47.34% |
| 2/21/2016 | Mountain West | San Jose State | 56 | San Diego State | 78 | 3317 | Event Center (San Jose St.) | 5000 | 66.34% |
| 2/20/2016 | Mountain West | Air Force | 76 | New Mexico | 72 | 3327 | Clune Arena | 5858 | 56.79% |
| 2/19/2016 | Ivy League | Penn | 79 | Brown | 74 | 3335 | Palestra | 8722 | 38.24% |
| 2/21/2016 | Missouri Valley | Missouri State | 62 | Loyola (CHI) | 75 | 3385 | JQH Arena | 11000 | 30.77% |
| 2/20/2016 | MAC | Buffalo | 88 | Bowling Green | 74 | 3397 | Alumni Arena | 6100 | 55.69% |
| 2/20/2016 | West Coast | Loyola Mary | 100 | San Francisco | 87 | 3407 | Gersten Pavilion | 4156 | 81.98% |
| 2/20/2016 | Big West | LBSU | 70 | CS Fullerton | 57 | 3519 | Walter Pyramid | 5000 | 70.38% |
| 2/20/2016 | Horizon League | Green Bay | 107 | Youngstown St | 90 | 3530 | Resch Center | 10200 | 34.61% |
| 2/20/2016 | Conference USA | W Kentucky | 59 | Charlotte | 54 | 3570 | E. A. Diddle Arena | 7326 | 48.73% |
| 2/19/2016 | Summit League | Oral Roberts | 62 | Denver | 58 | 3587 | Mabee Center | 11300 | 31.74% |
| 2/18/2016 | Southern | Chattanooga | 85 | VMI | 59 | 3589 | McKenzie Arena | 10928 | 32.84% |
| 2/18/2016 | Southern | Mercer | 65 | W Carolina | 72 | 3627 | Hawkins Arena | 3500 | 103.63% |
| 2/20/2016 | Colonial Athletic | Charleston | 55 | UNC Wilmington | 59 | 3629 | TD Arena | 5100 | 71.16% |
| 2/15/2016 | Horizon League | Green Bay | 70 | Milwaukee | 68 | 3685 | Resch Center | 10200 | 36.13% |
| 2/21/2016 | Atlantic 10 | UMass | 70 | George Mason | 64 | 3691 | William D. Mullins Memorial Center | 9493 | 38.88% |
| 2/20/2016 | Summit League | North Dakota St | 63 | IUPUI | 59 | 3812 | Scheels Arena | 6000 | 63.53% |
| 2/16/2016 | Atlantic 10 | Davidson | 83 | Richmond | 79 | 3832 | John M. Belk Arena | 5223 | 73.37% |
| 2/20/2016 | Big East | USF | 80 | Memphis | 71 | 3840 | USF Sun Dome | 10411 | 36.88% |
| 2/20/2016 | Conference USA | Rice | 86 | FIU | 70 | 3859 | Tudor Fieldhouse | 5750 | 67.11% |
| 2/20/2016 | MAC | W Michigan | 92 | Cent Michigan | 85 | 3869 | University Arena (MI) | 5421 | 71.37% |
| 2/20/2016 | Southern | Mercer | 74 | ETSU | 77 | 3874 | Hawkins Arena | 3500 | 110.69% |
| 2/20/2016 | Colonial Athletic | William & Mary | 69 | Drexel | 74 | 3948 | Kaplan Arena | 8600 | 45.91% |
| 2/20/2016 | Atlantic Sun | North Florida | 81 | USC Upstate | 78 | 4086 | UNF Arena | 5800 | 70.45% |
| 2/19/2016 | Horizon League | UIC | 72 | Detroit | 83 | 4110 | UIC Pavilion | 6958 | 59.07% |
| 2/21/2016 | Horizon League | Valparaiso | 90 | Detroit | 74 | 4151 | Athletics-Recreation Center | 5000 | 83.02% |
| 2/17/2016 | Atlantic 10 | Saint Joe’s | 79 | Dayton | 70 | 4200 | Hagan Arena | 4200 | 100.00% |
| 2/18/2016 | Ohio Valley | E Kentucky | 78 | Belmont | 86 | 4200 | McBrayer Arena | 6500 | 64.62% |
| 2/19/2016 | Ivy League | Princeton | 75 | Yale | 63 | 4211 | Jadwin Gymnasium | 6854 | 61.44% |
| 2/18/2016 | Atlantic Sun | FGCU | 82 | Lipscomb | 67 | 4271 | Alico Arena | 4500 | 94.91% |
| 2/16/2016 | The American | ECU | 52 | USF | 69 | 4299 | Minges Coliseum | 8000 | 53.74% |
| 2/20/2016 | Big South | Liberty | 73 | Presbyterian | 79 | 4323 | Vines Center | 8085 | 53.47% |
| 2/18/2016 | The American | Tulsa | 70 | Cincinnati | 68 | 4402 | Reynolds Center | 8355 | 52.69% |
| 2/20/2016 | Southern | The Citadel | 97 | W Carolina | 102 | 4424 | McAlister Field House | 6000 | 73.73% |
| 2/17/2016 | Missouri Valley | Illinois State | 78 | Indiana State | 50 | 4456 | Redbird Arena | 10200 | 43.69% |
| 2/21/2016 | The American | Houston | 66 | Temple | 69 | 4466 | Hofheinz Pavilion | 10000 | 44.66% |
| 2/19/2016 | MAAC | Monmouth | 67 | Iona | 83 | 4522 | Multipurpose Activity Center | 4100 | 110.29% |
| 2/18/2016 | Western Athletic | New Mexico St | 63 | CSU Bakersfield | 55 | 4550 | Pan American Center | 13071 | 34.81% |
| 2/17/2016 | America East | Albany | 82 | Stony Brook | 70 | 4578 | SEFCU Arena | 4538 | 100.88% |
| 2/20/2016 | Atlantic Sun | FGCU | 68 | Kennesaw St | 63 | 4633 | Alico Arena | 4500 | 102.96% |
| 2/20/2016 | Western Athletic | New Mexico St | 70 | Seattle | 57 | 4669 | Pan American Center | 13071 | 35.72% |
| 2/15/2016 | Horizon League | Wright State | 73 | Oakland | 89 | 4846 | Nutter Center | 10400 | 46.60% |
| 2/17/2016 | Mountain West | Wyoming | 75 | Fresno State | 79 | 4852 | Arena-Auditorium | 15028 | 32.29% |
| 2/19/2016 | Horizon League | Valparaiso | 86 | Oakland | 84 | 4863 | Athletics-Recreation Center | 5000 | 97.26% |
| 2/16/2016 | Big 12 | TCU | 49 | Kansas State | 63 | 4999 | Ed and Rae Schollmaier Arena | 7201 | 69.42% |
| 2/18/2016 | Big Sky | N Arizona | 81 | Idaho State | 68 | 5000 | J. Lawrence Walkup Skydome | 16230 | 30.81% |
| 2/17/2016 | Missouri Valley | S Illinois | 71 | Bradley | 59 | 5002 | SIU Arena | 8339 | 59.98% |
| 2/17/2016 | Big East | St John’s | 80 | DePaul | 65 | 5010 | Carnesecca Arena | 5602 | 89.43% |
| 2/16/2016 | SEC | Missouri | 72 | South Carolina | 67 | 5017 | Mizzou Arena | 15061 | 33.31% |
| 2/20/2016 | MEAC | MD-E Shore | 58 | S Carolina St | 62 | 5064 | Hytche Arena | 5500 | 92.07% |
| 2/20/2016 | Ohio Valley | Belmont | 95 | Tenn Tech | 86 | 5074 | Curb Event Center | 5085 | 99.78% |
| 2/20/2016 | Atlantic 10 | URI | 77 | Duquesne | 74 | 5112 | Thomas M. Ryan Center | 7657 | 66.76% |
| 2/15/2016 | MEAC | Hampton | 87 | Morgan State | 79 | 5123 | Convocation Center (VA) | 7200 | 71.15% |
| 2/17/2016 | Pac 12 | USC | 79 | Colorado | 72 | 5132 | Galen Center | 10258 | 50.03% |
| 2/19/2016 | MAC | Ball State | 63 | N Illinois | 59 | 5160 | John E. Worthen Arena | 11500 | 44.87% |
| 2/17/2016 | Big East | Georgetown | 64 | Seton Hall | 72 | 5278 | Verizon Center | 18506 | 28.52% |
| 2/20/2016 | Atlantic 10 | Davidson | 99 | Saint Joe’s | 93 | 5295 | John M. Belk Arena | 5223 | 101.38% |
| 2/20/2016 | Big Ten | Rutgers | 58 | Penn State | 70 | 5307 | Louis Brown Athletic Center | 8000 | 66.34% |
| 2/20/2016 | Ohio Valley | Austin Peay | 60 | Murray State | 76 | 5419 | Dave Aaron Arena | 9000 | 60.21% |
| 2/20/2016 | Patriot League | Navy | 78 | Army | 80 | 5510 | Alumni Hall | 5710 | 96.50% |
| 2/20/2016 | Colonial Athletic | JMU | 75 | Delaware | 50 | 5522 | JMU Convocation Center | 7156 | 77.17% |
| 2/16/2016 | Big 12 | Baylor | 100 | Iowa State | 91 | 5556 | Ferrell Center | 10347 | 53.70% |
| 2/20/2016 | Southern | Chattanooga | 64 | UNCG | 79 | 5718 | McKenzie Arena | 10928 | 52.32% |
| 2/20/2016 | Big 12 | Oklahoma State | 61 | Texas Tech | 71 | 5814 | Gallagher-Iba Arena | 13611 | 42.72% |
| 2/18/2016 | West Coast | Gonzaga | 90 | Pacific | 68 | 6000 | McCarthey Athletic Center | 6000 | 100.00% |
| 2/20/2016 | West Coast | Gonzaga | 58 | Saint Mary’s | 63 | 6000 | McCarthey Athletic Center | 6000 | 100.00% |
| 2/18/2016 | Western Athletic | Grand Canyon | 78 | UMKC | 66 | 6049 | GCU Arena | 7000 | 86.41% |
| 2/20/2016 | Missouri Valley | Northern Iowa | 75 | Illinois State | 66 | 6145 | McLeod Center | 6650 | 92.41% |
| 2/18/2016 | Conference USA | Marshall | 87 | Charlotte | 72 | 6164 | Cam Henderson Center | 10705 | 57.58% |
| 2/16/2016 | SEC | Miss St | 75 | Vanderbilt | 74 | 6194 | Humphrey Coliseum | 10575 | 58.57% |
| 2/20/2016 | MEAC | Florida A&M | 54 | Bethune-Cookman | 55 | 6211 | Al Lawson Center | 8470 | 73.33% |
| 2/16/2016 | MAC | Ohio | 86 | E Michigan | 64 | 6212 | Convocation Center | 13080 | 47.49% |
| 2/17/2016 | ACC | FSU | 80 | Georgia Tech | 86 | 6217 | Donald L. Tucker Center | 12100 | 51.38% |
| 2/19/2016 | MAC | Kent State | 85 | Akron | 76 | 6327 | MAC Center | 6327 | 100.00% |
| 2/21/2016 | The American | UCF | 67 | Tulsa | 75 | 6437 | CFE Arena | 9465 | 68.01% |
| 2/16/2016 | SEC | Texas A&M | 71 | Ole Miss | 56 | 6460 | Reed Arena | 12989 | 49.73% |
| 2/20/2016 | Big East | Villanova | 77 | Butler | 67 | 6500 | The Pavilion (Villanova) | 7926 | 82.01% |
| 2/20/2016 | Big Sky | Montana | 87 | Montana State | 78 | 6522 | Dahlberg Arena | 7321 | 89.09% |
| 2/17/2016 | Big Ten | Penn State | 79 | Iowa | 75 | 6590 | Bryce Jordan Center | 15261 | 43.18% |
| 2/17/2016 | ACC | Miami (FL) | 65 | Virginia Tech | 49 | 6614 | BankUnited Center | 8000 | 82.68% |
| 2/21/2016 | The American | SMU | 74 | ECU | 63 | 6852 | Moody Coliseum | 8998 | 76.15% |
| 2/18/2016 | Conference USA | UTEP | 78 | Southern Miss | 73 | 7012 | Don Haskins Center | 12222 | 57.37% |
| 2/20/2016 | Mountain West | Colorado State | 66 | Wyoming | 84 | 7067 | Moby Arena | 8745 | 80.81% |
| 2/20/2016 | Mountain West | Fresno State | 75 | Utah State | 68 | 7068 | Save Mart Center | 15544 | 45.47% |
| 2/20/2016 | Missouri Valley | Bradley | 73 | Drake | 70 | 7149 | Carver Arena | 11164 | 64.04% |
| 2/20/2016 | Missouri Valley | Evansville | 83 | S Illinois | 71 | 7163 | Ford Center | 19164 | 37.38% |
| 2/20/2016 | Western Athletic | Grand Canyon | 67 | Chicago State | 52 | 7223 | GCU Arena | 7000 | 103.19% |
| 2/18/2016 | Pac 12 | UCLA | 73 | Utah | 75 | 7249 | Pauley Pavilion | 12829 | 56.50% |
| 2/16/2016 | Big East | Butler | 88 | Creighton | 75 | 7330 | Hinkle Fieldhouse | 15000 | 48.87% |
| 2/18/2016 | Pac 12 | Washington | 75 | Cal | 78 | 7530 | Alaska Airlines Arena | 12961 | 58.10% |
| 2/16/2016 | Atlantic 10 | VCU | 83 | URI | 67 | 7637 | Stuart C. Siegel Center | 7637 | 100.00% |
| 2/19/2016 | Atlantic 10 | VCU | 87 | Richmond | 74 | 7637 | Stuart C. Siegel Center | 7637 | 100.00% |
| 2/21/2016 | Conference USA | Mid Tennessee | 67 | UAB | 77 | 7822 | Murphy Athletic Center | 11807 | 66.25% |
| 2/20/2016 | Horizon League | Wright State | 67 | N Kentucky | 64 | 7825 | Nutter Center | 10400 | 75.24% |
| 2/21/2016 | Pac 12 | USC | 69 | Utah | 80 | 7931 | Galen Center | 10258 | 77.32% |
| 2/16/2016 | SEC | Georgia | 53 | Florida | 57 | 8021 | Stegeman Coliseum | 11200 | 71.62% |
| 2/20/2016 | SEC | Auburn | 59 | Ole Miss | 69 | 8046 | Auburn Arena | 9121 | 88.21% |
| 2/17/2016 | ACC | Clemson | 65 | Boston College | 54 | 8101 | Bon Secours Wellness Arena | 14897 | 54.38% |
| 2/20/2016 | Pac 12 | UCLA | 77 | Colorado | 53 | 8492 | Pauley Pavilion | 12829 | 66.19% |
| 2/20/2016 | Conference USA | Marshall | 82 | Old Dominion | 65 | 8520 | Cam Henderson Center | 10705 | 79.59% |
| 2/20/2016 | Big East | DePaul | 60 | Marquette | 73 | 8524 | Allstate Arena | 17500 | 48.71% |
| 2/21/2016 | ACC | Wake Forest | 74 | Boston College | 48 | 8542 | Lawrence Joel Coliseum | 14665 | 58.25% |
| 2/20/2016 | Atlantic 10 | Saint Louis | 76 | Fordham | 68 | 8591 | Chaifetz Arena | 10600 | 81.05% |
| 2/20/2016 | ACC | Georgia Tech | 63 | Notre Dame | 62 | 8600 | McCamish Pavilion | 9191 | 93.57% |
| 2/16/2016 | ACC | Pitt | 101 | Wake Forest | 96 | 8825 | Petersen Events Center | 12508 | 70.55% |
| 2/20/2016 | MAC | Ohio | 76 | Miami (OH) | 64 | 9018 | Convocation Center | 13080 | 68.94% |
| 2/20/2016 | Pac 12 | Washington | 64 | Stanford | 53 | 9161 | Alaska Airlines Arena | 12961 | 70.68% |
| 2/17/2016 | Mountain West | Utah State | 72 | Colorado State | 59 | 9377 | Dee Glen Smith Spectrum | 10270 | 91.30% |
| 2/20/2016 | ACC | Virginia Tech | 83 | FSU | 73 | 9567 | Cassell Coliseum | 9847 | 97.16% |
| 2/17/2016 | Big East | Xavier | 85 | Providence | 74 | 10336 | Cintas Center | 10250 | 100.84% |
| 2/17/2016 | The American | Temple | 67 | Villanova | 83 | 10472 | Liacouras Center | 10206 | 102.61% |
| 2/15/2016 | Missouri Valley | Wichita State | 71 | New Mexico St | 41 | 10506 | Charles Koch Arena | 10506 | 100.00% |
| 2/18/2016 | Missouri Valley | Wichita State | 99 | Missouri State | 68 | 10506 | Charles Koch Arena | 10506 | 100.00% |
| 2/20/2016 | Big East | Georgetown | 70 | Xavier | 88 | 10652 | Verizon Center | 18506 | 57.56% |
| 2/17/2016 | SEC | LSU | 69 | Alabama | 76 | 10703 | Pete Maravich Assembly Center | 14351 | 74.58% |
| 2/18/2016 | Big Ten | Minnesota | 68 | Maryland | 63 | 10768 | Williams Arena | 14625 | 73.63% |
| 2/16/2016 | Big Ten | Illinois | 82 | Rutgers | 66 | 11323 | State Farm Center | 15500 | 73.05% |
| 2/20/2016 | SEC | Vanderbilt | 80 | Georgia | 67 | 11745 | Memorial Gymnasium (Vandy) | 15626 | 75.16% |
| 2/20/2016 | SEC | Texas A&M | 79 | Kentucky | 77 | 12029 | Reed Arena | 12989 | 92.61% |
| 2/16/2016 | Big 12 | Texas | 85 | West Virginia | 78 | 12284 | Frank Erwin Center | 16837 | 72.96% |
| 2/20/2016 | Pac 12 | Oregon | 91 | Oregon State | 81 | 12364 | Matthew Knight Arena | 12369 | 99.96% |
| 2/17/2016 | Mountain West | New Mexico | 80 | Boise State | 78 | 12434 | WisePies Arena | 15411 | 80.68% |
| 2/17/2016 | The American | Memphis | 73 | UCF | 56 | 12492 | FedExForum | 18119 | 68.94% |
| 2/20/2016 | Big 12 | Kansas State | 63 | Kansas | 72 | 12528 | Bramlage Coliseum | 13762 | 91.03% |
| 2/16/2016 | Big Ten | Purdue | 71 | Northwestern | 61 | 12868 | Mackey Arena | 14846 | 86.68% |
| 2/20/2016 | Big East | Cincinnati | 65 | UConn | 60 | 13176 | Fifth Third Arena | 13176 | 100.00% |
| 2/21/2016 | Big East | St John’s | 61 | Seton Hall | 62 | 13204 | Madison Square Garden | 19812 | 66.65% |
| 2/20/2016 | Atlantic 10 | Dayton | 72 | St Bonaventure | 79 | 13455 | University of Dayton Arena | 13435 | 100.15% |
| 2/15/2016 | ACC | UVA | 73 | NC State | 53 | 14016 | John Paul Jones Arena | 14593 | 96.05% |
| 2/17/2016 | SEC | Arkansas | 86 | Auburn | 90 | 14351 | Bud Walton Arena | 20320 | 70.63% |
| 2/20/2016 | Big 12 | Iowa State | 92 | TCU | 83 | 14384 | Hilton Coliseum | 14356 | 100.20% |
| 2/17/2016 | Big 12 | Texas Tech | 65 | Oklahoma | 63 | 14471 | United Supermarkets Arena | 15020 | 96.34% |
| 2/20/2016 | Mountain West | UNLV | 102 | Nevada | 91 | 14640 | Thomas & Mack Center | 18776 | 77.97% |
| 2/17/2016 | Pac 12 | Arizona | 99 | Arizona State | 61 | 14644 | McKale Center | 14545 | 100.68% |
| 2/18/2016 | Big Ten | Michigan State | 69 | Wisconsin | 57 | 14797 | Breslin Center | 16280 | 90.89% |
| 2/20/2016 | Big 12 | West Virginia | 62 | Oklahoma | 76 | 15289 | WVU Coliseum | 14000 | 109.21% |
| 2/20/2016 | SEC | Alabama | 61 | Miss St | 67 | 15383 | Coleman Coliseum | 15383 | 100.00% |
| 2/18/2016 | Big East | UConn | 68 | SMU | 62 | 15564 | XL Center | 15564 | 100.00% |
| 2/20/2016 | Big Ten | Nebraska | 62 | OSU | 65 | 15679 | Pinnacle Bank Arena | 15147 | 103.51% |
| 2/15/2016 | Big 12 | Kansas | 94 | Oklahoma State | 67 | 16300 | Allen Fieldhouse | 16300 | 100.00% |
| 2/20/2016 | West Coast | BYU | 91 | San Diego | 33 | 16324 | Marriott Center | 22700 | 71.91% |
| 2/20/2016 | Big 12 | Texas | 64 | Baylor | 78 | 16540 | Frank Erwin Center | 16837 | 98.24% |
| 2/20/2016 | SEC | Arkansas | 84 | Missouri | 72 | 16617 | Bud Walton Arena | 20320 | 81.78% |
| 2/16/2016 | Big Ten | OSU | 76 | Michigan | 66 | 17088 | Value City Arena | 18809 | 90.85% |
| 2/21/2016 | Big Ten | Wisconsin | 69 | Illinois | 60 | 17287 | Kohl Center | 17230 | 100.33% |
| 2/17/2016 | Big Ten | Indiana | 80 | Nebraska | 64 | 17472 | Assembly Hall (Indiana) | 17472 | 100.00% |
| 2/20/2016 | Big Ten | Indiana | 77 | Purdue | 73 | 17472 | Assembly Hall (Indiana) | 17472 | 100.00% |
| 2/20/2016 | ACC | NC State | 77 | Clemson | 74 | 17536 | PNC Arena | 18680 | 93.88% |
| 2/21/2016 | Big Ten | Maryland | 86 | Michigan | 82 | 17950 | XFINITY Center | 17950 | 100.00% |
| 2/20/2016 | SEC | South Carolina | 73 | Florida | 69 | 18000 | Colonial Life Arena | 18000 | 100.00% |
| 2/20/2016 | SEC | Tennessee | 81 | LSU | 65 | 19721 | Thompson-Boling Arena | 21678 | 90.97% |
| 2/20/2016 | ACC | UNC | 96 | Miami (FL) | 71 | 20151 | Dean E. Smith Center | 21750 | 92.65% |
| 2/17/2016 | ACC | Louisville | 72 | Syracuse | 58 | 21654 | KFC Yum! Center | 22090 | 98.03% |
| 2/17/2016 | ACC | UNC | 73 | Duke | 74 | 21750 | Dean E. Smith Center | 21750 | 100.00% |
| 2/20/2016 | ACC | Louisville | 71 | Duke | 64 | 22785 | KFC Yum! Center | 22090 | 103.15% |
| 2/18/2016 | SEC | Kentucky | 80 | Tennessee | 70 | 24274 | Rupp Arena | 23500 | 103.29% |
| 2/20/2016 | ACC | Syracuse | 52 | Pitt | 66 | 28696 | Carrier Dome | 35446 | 80.96% |