NCAA Basketball Attendance Week 16: The Winners and Losers
#SLCMBB: Triple by @McNeeseSports Harvey. One point game vs. @sluathletics with 27 seconds to go @liveonasn. pic.twitter.com/2z5jtYguGS
— Southland Conference (@SouthlandSports) February 16, 2016
1. New Orleans vs Texas A&M – Corpus Christi - And finally, elsewhere in the Southland: The New Orleans Privateers hosted the Texas A&M - Corpus Christi Islanders (Some say the school is a little TACCI.[note]I'll see myself out[/note]). Despite that TAMU-CC (Seriously, their damn abbreviation is 50% longer than Iona or Yale's full names) is sitting only a handful of games behind Stephen F. Austin for the Southland lead, a mere 332 showed up to see the eventual Southland 2 seed win 65-57. Even with terrible basketball and no chance of a postseason for either team, 332 dedicated folks in the Crescent City. Good for them. And of course, your action shot of the week!
[caption id="attachment_1360" align="aligncenter" width="600"]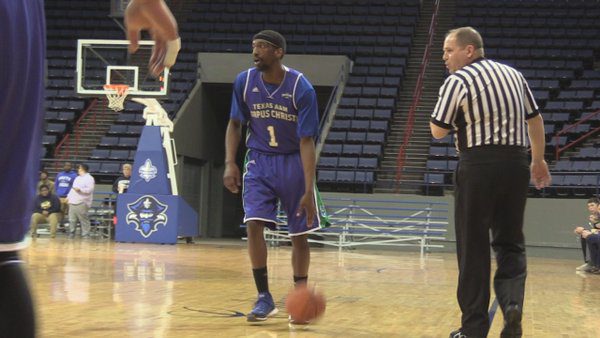 Image courtesy Twitter.com / @kiii3sports[/caption]
And now, as always, the miscellany:
Biggest group of people to see a loss at home this week: Syracuse (vs Pitt) 28,696.
Smallest group of people to see a win at home this week: St. Peter’s (vs Manhattan), 473.
Smallest Power Conference attendance: Washington State (vs Stanford), 2,711.
Smallest Power Conference home win attendance: Missouri (vs South Carolina), 5,017.
Average attendance this week: 4,975, up 159 (3.3%) over last week.
And as always, your full attendance numbers for the week:
Image courtesy Twitter.com / @kiii3sports[/caption]
And now, as always, the miscellany:
Biggest group of people to see a loss at home this week: Syracuse (vs Pitt) 28,696.
Smallest group of people to see a win at home this week: St. Peter’s (vs Manhattan), 473.
Smallest Power Conference attendance: Washington State (vs Stanford), 2,711.
Smallest Power Conference home win attendance: Missouri (vs South Carolina), 5,017.
Average attendance this week: 4,975, up 159 (3.3%) over last week.
And as always, your full attendance numbers for the week:
| Date | Conference | Home Team | Home Score | Away Team | Away Score | Attendance | Venue | Capacity | % full |
|---|---|---|---|---|---|---|---|---|---|
| 2/15/2016 | Southland | New Orleans | 57 | Texas A&M-CC | 65 | 332 | Lakefront Arena | 10000 | 3.32% |
| 2/15/2016 | Southland | McNeese State | 76 | SE Louisiana | 79 | 350 | Burton Coliseum | 6500 | 5.38% |
| 2/18/2016 | Northeast | Bryant | 57 | Sacred Heart | 74 | 431 | Chace Athletic Center | 2700 | 15.96% |
| 2/17/2016 | MAAC | St Peter's | 70 | Manhattan | 69 | 473 | Yanitelli Center | 3200 | 14.78% |
| 2/20/2016 | Southland | Nicholls State | 53 | SF Austin | 88 | 522 | Stopher Gymnasium | 3800 | 13.74% |
| 2/15/2016 | MEAC | Coppin State | 67 | Delaware State | 71 | 533 | Physical Education Complex | 4100 | 13.00% |
| 2/20/2016 | Northeast | Bryant | 53 | Mt St Mary's | 71 | 580 | Chace Athletic Center | 2700 | 21.48% |
| 2/15/2016 | SWAC | Southern | 97 | Miss Valley St | 64 | 599 | F. G. Clark Activity Center | 7500 | 7.99% |
| 2/18/2016 | Big South | Presbyterian | 61 | UNC Asheville | 70 | 606 | Ross E. Templeton P.E. Center | 2300 | 26.35% |
| 2/18/2016 | Atlantic Sun | Jacksonville | 81 | USC Upstate | 76 | 628 | Jacksonville Veterans Memorial | 14091 | 4.46% |
| 2/20/2016 | Big Sky | Portland State | 107 | E Washington | 91 | 633 | Stott Center | 1500 | 42.20% |
| 2/18/2016 | Big Sky | Sacramento St | 88 | E Washington | 93 | 649 | The Nest | 900 | 72.11% |
| 2/18/2016 | Big West | UC Riverside | 55 | UCSB | 65 | 665 | SRC Arena | 3168 | 20.99% |
| 2/17/2016 | Patriot League | American U | 60 | Lafayette | 59 | 675 | Bender Arena | 4500 | 15.00% |
| 2/15/2016 | SWAC | PV A&M | 66 | Jackson State | 80 | 687 | William Nicks Building | 6500 | 10.57% |
| 2/15/2016 | Southland | Houston Baptist | 79 | Lamar | 78 | 703 | Sharp Gymnasium | 1500 | 46.87% |
| 2/17/2016 | Patriot League | Boston U | 71 | Colgate | 68 | 705 | Case Gym | 1800 | 39.17% |
| 2/15/2016 | Patriot League | Lehigh | 64 | Holy Cross | 59 | 710 | Stabler Arena | 6000 | 11.83% |
| 2/15/2016 | Southland | Cent Arkansas | 107 | Northwestern St | 94 | 715 | Farris Center | 6000 | 11.92% |
| 2/18/2016 | Atlantic Sun | Stetson | 82 | Kennesaw St | 92 | 722 | Edmunds Center | 5000 | 14.44% |
| 2/20/2016 | SWAC | Grambling St | 58 | Jackson State | 61 | 749 | Fredrick C. Hobdy Assembly Center | 7500 | 9.99% |
| 2/20/2016 | Atlantic Sun | Stetson | 74 | Lipscomb | 77 | 761 | Edmunds Center | 5000 | 15.22% |
| 2/20/2016 | SWAC | AR-Pine Bluff | 55 | PV A&M | 57 | 798 | H. O. Clemmons Arena | 4500 | 17.73% |
| 2/15/2016 | MEAC | NC A&T | 77 | Bethune-Cookman | 83 | 823 | Corbett Sports Center | 5700 | 14.44% |
| 2/15/2016 | Northeast | St Francis (BKN) | 67 | LIU Brooklyn | 82 | 825 | Pope Physical Education Center | 2000 | 41.25% |
| 2/18/2016 | Southland | Houston Baptist | 73 | Abil Christian | 71 | 827 | Sharp Gymnasium | 1500 | 55.13% |
| 2/20/2016 | Big Sky | Sacramento St | 68 | Idaho | 65 | 845 | The Nest | 900 | 93.89% |
| 2/17/2016 | America East | UNH | 80 | UMass Lowell | 69 | 882 | Lundholm Gymnasium | 6501 | 13.57% |
| 2/20/2016 | SWAC | Miss Valley St | 67 | Texas Southern | 98 | 898 | Leflore County Civic Center | 1801 | 49.86% |
| 2/18/2016 | Big Sky | Portland State | 74 | Idaho | 80 | 920 | Stott Center | 1500 | 61.33% |
| 2/21/2016 | Patriot League | Colgate | 93 | Loyola (MD) | 90 | 943 | Cotterell Court | 3000 | 31.43% |
| 2/18/2016 | Northeast | Robert Morris | 74 | LIU Brooklyn | 67 | 952 | Charles L. Sewall Center | 3056 | 31.15% |
| 2/15/2016 | MAAC | Fairfield | 76 | Marist | 73 | 956 | Webster Bank Arena | 10000 | 9.56% |
| 2/18/2016 | Colonial Athletic | Drexel | 76 | Elon | 81 | 976 | Daskalakis Athletic Center | 2532 | 38.55% |
| 2/20/2016 | Atlantic Sun | Jacksonville | 58 | NJIT | 73 | 1003 | Jacksonville Veterans Memorial | 14091 | 7.12% |
| 2/21/2016 | MAAC | St Peter's | 75 | Monmouth | 82 | 1013 | Yanitelli Center | 3200 | 31.66% |
| 2/18/2016 | Southern | Samford | 77 | UNCG | 82 | 1021 | Pete Hanna Center | 4974 | 20.53% |
| 2/17/2016 | Summit League | IUPUI | 88 | Omaha | 76 | 1044 | Indiana Farmers Coliseum | 6500 | 16.06% |
| 2/17/2016 | Patriot League | Navy | 74 | Lehigh | 77 | 1068 | Alumni Hall | 5710 | 18.70% |
| 2/15/2016 | Southland | Abil Christian | 71 | Sam Houston | 84 | 1075 | Mabee Athletic Complex | 2400 | 44.79% |
| 2/18/2016 | MAAC | Quinnipiac | 56 | St Peter's | 55 | 1075 | TD Bank Sports Center | 3570 | 30.11% |
| 2/17/2016 | Patriot League | Army | 72 | Holy Cross | 68 | 1086 | Christl Arena | 5043 | 21.53% |
| 2/19/2016 | Ivy League | Cornell | 66 | Dartmouth | 78 | 1098 | Newman Arena | 4473 | 24.55% |
| 2/20/2016 | MEAC | Morgan State | 59 | NC Central | 73 | 1104 | Hill Field House | 4250 | 25.98% |
| 2/18/2016 | Northeast | Fair Dickinson | 74 | Wagner | 94 | 1116 | Rothman Center | 5000 | 22.32% |
| 2/16/2016 | Big South | Campbell | 110 | Allen | 66 | 1135 | Pope Convocation Center | 3095 | 36.67% |
| 2/18/2016 | MAAC | Canisius | 71 | Fairfield | 74 | 1137 | Koessler Athletic Center | 2176 | 52.25% |
| 2/16/2016 | MAC | N Illinois | 71 | Bowling Green | 60 | 1148 | NIU Convocation Center | 10000 | 11.48% |
| 2/17/2016 | America East | Hartford | 88 | UMBC | 65 | 1154 | Chase Arena | 4107 | 28.10% |
| 2/16/2016 | Horizon League | Youngstown St | 92 | UIC | 91 | 1162 | Beeghly Center | 6500 | 17.88% |
| 2/18/2016 | MAAC | Niagara | 76 | Marist | 72 | 1163 | Gallagher Center | 2400 | 48.46% |
| 2/20/2016 | Summit League | W Illinois | 67 | South Dakota St | 87 | 1166 | Western Hall | 5139 | 22.69% |
| 2/20/2016 | MEAC | Howard | 56 | Savannah State | 66 | 1205 | Burr Gymnasium | 2700 | 44.63% |
| 2/17/2016 | Big West | CS Fullerton | 77 | UC Irvine | 96 | 1209 | Titan Gym | 5015 | 24.11% |
| 2/15/2016 | SWAC | Alcorn State | 79 | AR-Pine Bluff | 60 | 1213 | Davey Whitney Complex | 7000 | 17.33% |
| 2/18/2016 | Big South | Longwood | 80 | High Point | 88 | 1218 | Willett Hall | 2522 | 48.30% |
| 2/20/2016 | Northeast | Fair Dickinson | 86 | Sacred Heart | 91 | 1228 | Rothman Center | 5000 | 24.56% |
| 2/20/2016 | SWAC | Alabama A&M | 58 | Alcorn State | 62 | 1237 | T.M. Elmore Gymnasium | 6000 | 20.62% |
| 2/20/2016 | Conference USA | UTSA | 74 | Southern Miss | 53 | 1250 | UTSA Convocation Center | 4080 | 30.64% |
| 2/18/2016 | Sun Belt | Appalachian St | 71 | South Alabama | 75 | 1253 | Holmes Convocation Center | 8325 | 15.05% |
| 2/18/2016 | Conference USA | UTSA | 74 | LA Tech | 87 | 1258 | UTSA Convocation Center | 4080 | 30.83% |
| 2/20/2016 | MAAC | Niagara | 59 | Fairfield | 71 | 1270 | Gallagher Center | 2400 | 52.92% |
| 2/21/2016 | America East | Maine | 56 | Stony Brook | 75 | 1285 | Cross Insurance Center | 5800 | 22.16% |
| 2/20/2016 | Western Athletic | UT Rio Grande | 57 | CSU Bakersfield | 70 | 1299 | UTRGV Fieldhouse | 2500 | 51.96% |
| 2/20/2016 | MAAC | Canisius | 81 | Marist | 66 | 1318 | Koessler Athletic Center | 2176 | 60.57% |
| 2/20/2016 | SWAC | Alabama State | 77 | Southern | 68 | 1324 | Dunn-Oliver Acadome | 7400 | 17.89% |
| 2/17/2016 | Atlantic 10 | La Salle | 71 | St Bonaventure | 64 | 1329 | Tom Gola Arena | 4000 | 33.23% |
| 2/20/2016 | Southern | Samford | 73 | VMI | 67 | 1332 | Pete Hanna Center | 4974 | 26.78% |
| 2/18/2016 | Northeast | St Francis (PA) | 58 | St Francis (BKN) | 70 | 1381 | DeGol Arena | 3500 | 39.46% |
| 2/18/2016 | Big South | Gardner-Webb | 84 | Charleston So | 76 | 1383 | Paul Porter Arena | 5000 | 27.66% |
| 2/18/2016 | Southern | The Citadel | 51 | ETSU | 67 | 1389 | McAlister Field House | 6000 | 23.15% |
| 2/20/2016 | America East | UMBC | 54 | Vermont | 99 | 1389 | Retriever Activities Center | 4024 | 34.52% |
| 2/18/2016 | Conference USA | Rice | 90 | FAU | 85 | 1400 | Tudor Fieldhouse | 5750 | 24.35% |
| 2/20/2016 | Southland | McNeese State | 76 | Lamar | 87 | 1403 | Burton Coliseum | 6500 | 21.58% |
| 2/15/2016 | MAAC | Iona | 78 | Quinnipiac | 59 | 1421 | Hynes Athletics Center | 2611 | 54.42% |
| 2/20/2016 | Southland | Texas A&M-CC | 90 | Incarnate Word | 69 | 1422 | American Bank Center | 10000 | 14.22% |
| 2/15/2016 | SWAC | Texas Southern | 79 | Grambling St | 72 | 1426 | H&PE Arena | 8100 | 17.60% |
| 2/18/2016 | Western Athletic | UT Rio Grande | 67 | Seattle | 57 | 1435 | UTRGV Fieldhouse | 2500 | 57.40% |
| 2/16/2016 | Mountain West | Air Force | 79 | UNLV | 74 | 1445 | Clune Arena | 5858 | 24.67% |
| 2/18/2016 | West Coast | Pepperdine | 72 | San Francisco | 82 | 1449 | Firestone Fieldhouse | 4500 | 32.20% |
| 2/18/2016 | Summit League | IPFW | 91 | South Dakota St | 79 | 1452 | Allen County War Memorial Coliseum | 13000 | 11.17% |
| 2/20/2016 | Conference USA | North Texas | 70 | FAU | 62 | 1466 | UNT Coliseum | 10040 | 14.60% |
| 2/20/2016 | Sun Belt | Georgia State | 69 | Arkansas State | 61 | 1468 | GSU Sports Arena | 4500 | 32.62% |
| 2/15/2016 | MEAC | NC Central | 79 | Florida A&M | 74 | 1478 | McDougald-McLendon Gymnasium | 3056 | 48.36% |
| 2/17/2016 | Summit League | South Dakota | 82 | York | 55 | 1480 | The DakotaDome | 10000 | 14.80% |
| 2/18/2016 | Sun Belt | Georgia State | 49 | AR-Little Rock | 57 | 1516 | GSU Sports Arena | 4500 | 33.69% |
| 2/17/2016 | Atlantic 10 | Duquesne | 74 | G Washington | 81 | 1520 | A.J. Palumbo Center | 4406 | 34.50% |
| 2/20/2016 | Northeast | St Francis (PA) | 89 | LIU Brooklyn | 94 | 1531 | DeGol Arena | 3500 | 43.74% |
| 2/16/2016 | Horizon League | Cleveland State | 43 | Valparaiso | 66 | 1545 | Quicken Loans Arena | 20562 | 7.51% |
| 2/17/2016 | Mountain West | San Jose State | 55 | Nevada | 61 | 1560 | Event Center (San Jose St.) | 5000 | 31.20% |
| 2/20/2016 | Big Sky | Southern Utah | 71 | Idaho State | 89 | 1568 | Centrum Arena | 5300 | 29.58% |
| 2/17/2016 | The American | Tulane | 69 | Houston | 82 | 1593 | Devlin Fieldhouse | 3600 | 44.25% |
| 2/20/2016 | MAC | E Michigan | 91 | Toledo | 85 | 1636 | Convocation Center (MI) | 8824 | 18.54% |
| 2/21/2016 | Summit League | South Dakota | 71 | Denver | 76 | 1644 | The DakotaDome | 10000 | 16.44% |
| 2/19/2016 | MAAC | Rider | 64 | Siena | 84 | 1650 | Alumni Gymnasium (Rider) | 1650 | 100.00% |
| 2/18/2016 | Big West | CS Northridge | 63 | Hawaii | 69 | 1683 | Matadome | 3106 | 54.19% |
| 2/17/2016 | Missouri Valley | Loyola (CHI) | 59 | Northern Iowa | 56 | 1690 | Joseph J. Gentile Center | 4486 | 37.67% |
| 2/20/2016 | Sun Belt | Ga Southern | 61 | AR-Little Rock | 75 | 1702 | W. S. Hanner Fieldhouse | 4325 | 39.35% |
| 2/18/2016 | Ohio Valley | SE Missouri St | 69 | SIU ED | 72 | 1705 | Show Me Center | 6972 | 24.45% |
| 2/16/2016 | MAC | Miami (OH) | 56 | Ball State | 73 | 1706 | Millett Hall | 6400 | 26.66% |
| 2/18/2016 | Ohio Valley | UT Martin | 87 | E Illinois | 84 | 1709 | Skyhawk Arena | 5000 | 34.18% |
| 2/18/2016 | Colonial Athletic | Delaware | 62 | Charleston | 59 | 1831 | Bob Carpenter Center | 5000 | 36.62% |
| 2/20/2016 | Summit League | IPFW | 94 | Omaha | 90 | 1832 | Allen County War Memorial Coliseum | 13000 | 14.09% |
| 2/20/2016 | MEAC | Delaware State | 67 | Norfolk State | 64 | 1846 | Memorial Hall (Dover, DE) | 3000 | 61.53% |
| 2/18/2016 | Sun Belt | Ga Southern | 90 | Arkansas State | 59 | 1849 | W. S. Hanner Fieldhouse | 4325 | 42.75% |
| 2/20/2016 | Big South | Gardner-Webb | 81 | Longwood | 71 | 1854 | Paul Porter Arena | 5000 | 37.08% |
| 2/21/2016 | Patriot League | Holy Cross | 70 | American U | 71 | 1909 | Hart Center | 3600 | 53.03% |
| 2/20/2016 | Big South | Winthrop | 81 | UNC Asheville | 80 | 1919 | Winthrop Coliseum | 6100 | 31.46% |
| 2/20/2016 | Southland | Northwestern St | 99 | New Orleans | 102 | 1928 | Prather Coliseum | 3900 | 49.44% |
| 2/20/2016 | Ivy League | Cornell | 74 | Harvard | 76 | 1938 | Newman Arena | 4473 | 43.33% |
| 2/21/2016 | Patriot League | Lehigh | 73 | Lafayette | 61 | 1949 | Stabler Arena | 6000 | 32.48% |
| 2/18/2016 | Colonial Athletic | Hofstra | 84 | Towson | 82 | 1958 | Mack Sports Complex | 5124 | 38.21% |
| 2/20/2016 | West Coast | Pepperdine | 88 | Santa Clara | 76 | 1977 | Firestone Fieldhouse | 4500 | 43.93% |
| 2/17/2016 | America East | Vermont | 78 | Binghamton | 64 | 1989 | Patrick Gymnasium | 3228 | 61.62% |
| 2/18/2016 | Sun Belt | UT-Arlington | 84 | LA-Lafayette | 83 | 2010 | College Park Center | 7000 | 28.71% |
| 2/18/2016 | Big Sky | Southern Utah | 83 | Weber State | 87 | 2028 | Centrum Arena | 5300 | 38.26% |
| 2/15/2016 | #N/A | UNCG | 65 | Wofford | 61 | 2035 | Greensboro Coliseum | 21273 | 9.57% |
| 2/20/2016 | Sun Belt | Appalachian St | 78 | Troy | 74 | 2069 | Holmes Convocation Center | 8325 | 24.85% |
| 2/20/2016 | Sun Belt | Texas State | 61 | LA-Lafayette | 57 | 2104 | Strahan Coliseum | 7200 | 29.22% |
| 2/18/2016 | Western Athletic | Utah Valley | 74 | Chicago State | 72 | 2115 | UCCU Center | 8500 | 24.88% |
| 2/20/2016 | Big West | UCSB | 62 | UC Davis | 55 | 2116 | The Thunderdome | 6512 | 32.49% |
| 2/16/2016 | MAC | Cent Michigan | 77 | Toledo | 69 | 2139 | McGuirk Arena | 5300 | 40.36% |
| 2/20/2016 | Southland | Sam Houston | 105 | Cent Arkansas | 75 | 2139 | Bernard G. Johnson Coliseum | 6110 | 35.01% |
| 2/20/2016 | Ohio Valley | SE Missouri St | 68 | E Illinois | 71 | 2142 | Show Me Center | 6972 | 30.72% |
| 2/18/2016 | Big South | Winthrop | 79 | Coast Carolina | 67 | 2151 | Winthrop Coliseum | 6100 | 35.26% |
| 2/20/2016 | Big West | Cal Poly | 71 | CS Northridge | 75 | 2216 | Mott Athletics Center | 3032 | 73.09% |
| 2/17/2016 | Summit League | North Dakota St | 63 | W Illinois | 54 | 2227 | Scheels Arena | 6000 | 37.12% |
| 2/20/2016 | Northeast | Robert Morris | 72 | St Francis (BKN) | 82 | 2284 | Charles L. Sewall Center | 3056 | 74.74% |
| 2/20/2016 | Big South | Radford | 72 | High Point | 75 | 2331 | Donald N. Dedmon Center | 3205 | 72.73% |
| 2/17/2016 | Atlantic 10 | Fordham | 76 | UMass | 66 | 2341 | Rose Hill Gymnasium | 3470 | 67.46% |
| 2/20/2016 | Ohio Valley | Tennessee St | 61 | Jacksonville St | 46 | 2341 | Gentry Center | 10500 | 22.30% |
| 2/20/2016 | Ivy League | Columbia | 73 | Dartmouth | 54 | 2349 | Levien Gymnasium | 3408 | 68.93% |
| 2/16/2016 | Horizon League | N Kentucky | 68 | Detroit | 74 | 2357 | The Bank of Kentucky Center | 9400 | 25.07% |
| 2/18/2016 | Big West | Cal Poly | 58 | UC Davis | 53 | 2363 | Mott Athletics Center | 3032 | 77.94% |
| 2/20/2016 | Big Sky | North Dakota | 74 | N Colorado | 73 | 2424 | Betty Engelstad Sioux Center | 3300 | 73.45% |
| 2/18/2016 | Sun Belt | Texas State | 57 | UL Monroe | 76 | 2452 | Strahan Coliseum | 7200 | 34.06% |
| 2/21/2016 | MAAC | Quinnipiac | 59 | Manhattan | 63 | 2466 | TD Bank Sports Center | 3570 | 69.08% |
| 2/20/2016 | Ohio Valley | UT Martin | 68 | SIU ED | 51 | 2471 | Skyhawk Arena | 5000 | 49.42% |
| 2/17/2016 | Patriot League | Bucknell | 87 | Loyola (MD) | 52 | 2493 | Sojka Pavilion | 4000 | 62.33% |
| 2/16/2016 | Ohio Valley | Morehead State | 105 | St. Catharine | 66 | 2511 | Ellis T. Johnson Arena | 6500 | 38.63% |
| 2/19/2016 | Ivy League | Columbia | 90 | Harvard | 76 | 2587 | Levien Gymnasium | 3408 | 75.91% |
| 2/18/2016 | Atlantic Sun | North Florida | 107 | NJIT | 71 | 2611 | UNF Arena | 5800 | 45.02% |
| 2/20/2016 | Horizon League | Milwaukee | 88 | Cleveland State | 54 | 2689 | UW-Milwaukee Panther Arena | 12700 | 21.17% |
| 2/18/2016 | Pac 12 | Washington St | 56 | Stanford | 72 | 2711 | Friel Court | 12058 | 22.48% |
| 2/20/2016 | Colonial Athletic | Towson | 67 | Elon | 56 | 2736 | SECU Arena | 5250 | 52.11% |
| 2/15/2016 | Southern | ETSU | 83 | W Carolina | 77 | 2752 | Freedom Hall Civic Center | 5619 | 48.98% |
| 2/20/2016 | Ivy League | Princeton | 77 | Brown | 66 | 2772 | Jadwin Gymnasium | 6854 | 40.44% |
| 2/17/2016 | Missouri Valley | Drake | 74 | Evansville | 80 | 2790 | The Knapp Center | 7152 | 39.01% |
| 2/18/2016 | Ohio Valley | Morehead State | 66 | Tennessee St | 61 | 2800 | Ellis T. Johnson Arena | 6500 | 43.08% |
| 2/18/2016 | Big South | Liberty | 67 | Radford | 69 | 2802 | Vines Center | 8085 | 34.66% |
| 2/18/2016 | West Coast | Portland | 72 | Saint Mary's | 74 | 2868 | Chiles Center | 4852 | 59.11% |
| 2/20/2016 | America East | Binghamton | 81 | UMass Lowell | 77 | 2884 | Events Center (Binghamton) | 5142 | 56.09% |
| 2/21/2016 | Horizon League | UIC | 63 | Oakland | 74 | 2888 | UIC Pavilion | 6958 | 41.51% |
| 2/15/2016 | Southland | SF Austin | 84 | Incarnate Word | 46 | 2892 | William R. Johnson Coliseum | 7203 | 40.15% |
| 2/20/2016 | Western Athletic | Utah Valley | 79 | UMKC | 70 | 2981 | UCCU Center | 8500 | 35.07% |
| 2/21/2016 | Atlantic 10 | G Washington | 90 | La Salle | 50 | 3002 | Charles E. Smith Center | 4338 | 69.20% |
| 2/17/2016 | Atlantic 10 | George Mason | 77 | Saint Louis | 79 | 3015 | EagleBank Arena | 10000 | 30.15% |
| 2/16/2016 | Sun Belt | South Alabama | 54 | Troy | 61 | 3027 | Mitchell Center | 10041 | 30.15% |
| 2/21/2016 | Colonial Athletic | Hofstra | 65 | Northeastern | 60 | 3030 | Mack Sports Complex | 5124 | 59.13% |
| 2/16/2016 | MAC | Kent State | 85 | W Michigan | 78 | 3035 | MAC Center | 6327 | 47.97% |
| 2/15/2016 | MAAC | Monmouth | 79 | Manhattan | 70 | 3040 | Multipurpose Activity Center | 4100 | 74.15% |
| 2/21/2016 | Patriot League | Bucknell | 80 | Boston U | 59 | 3044 | Sojka Pavilion | 4000 | 76.10% |
| 2/18/2016 | West Coast | San Diego | 67 | BYU | 69 | 3056 | Jenny Craig Pavilion | 5100 | 59.92% |
| 2/16/2016 | MAC | Akron | 80 | Buffalo | 70 | 3069 | James A. Rhodes Arena | 5500 | 55.80% |
| 2/20/2016 | West Coast | Portland | 80 | Pacific | 67 | 3103 | Chiles Center | 4852 | 63.95% |
| 2/20/2016 | Southern | Wofford | 77 | Furman | 73 | 3120 | Benjamin Johnson Arena | 3500 | 89.14% |
| 2/18/2016 | Colonial Athletic | William & Mary | 87 | UNC Wilmington | 69 | 3148 | Kaplan Arena | 8600 | 36.60% |
| 2/18/2016 | Colonial Athletic | JMU | 94 | Northeastern | 95 | 3152 | JMU Convocation Center | 7156 | 44.05% |
| 2/18/2016 | Conference USA | W Kentucky | 56 | Old Dominion | 59 | 3182 | E. A. Diddle Arena | 7326 | 43.43% |
| 2/21/2016 | Pac 12 | Washington St | 62 | Cal | 80 | 3203 | Friel Court | 12058 | 26.56% |
| 2/20/2016 | Ivy League | Penn | 58 | Yale | 79 | 3246 | Palestra | 8722 | 37.22% |
| 2/20/2016 | Sun Belt | UT-Arlington | 61 | UL Monroe | 64 | 3314 | College Park Center | 7000 | 47.34% |
| 2/21/2016 | Mountain West | San Jose State | 56 | San Diego State | 78 | 3317 | Event Center (San Jose St.) | 5000 | 66.34% |
| 2/20/2016 | Mountain West | Air Force | 76 | New Mexico | 72 | 3327 | Clune Arena | 5858 | 56.79% |
| 2/19/2016 | Ivy League | Penn | 79 | Brown | 74 | 3335 | Palestra | 8722 | 38.24% |
| 2/21/2016 | Missouri Valley | Missouri State | 62 | Loyola (CHI) | 75 | 3385 | JQH Arena | 11000 | 30.77% |
| 2/20/2016 | MAC | Buffalo | 88 | Bowling Green | 74 | 3397 | Alumni Arena | 6100 | 55.69% |
| 2/20/2016 | West Coast | Loyola Mary | 100 | San Francisco | 87 | 3407 | Gersten Pavilion | 4156 | 81.98% |
| 2/20/2016 | Big West | LBSU | 70 | CS Fullerton | 57 | 3519 | Walter Pyramid | 5000 | 70.38% |
| 2/20/2016 | Horizon League | Green Bay | 107 | Youngstown St | 90 | 3530 | Resch Center | 10200 | 34.61% |
| 2/20/2016 | Conference USA | W Kentucky | 59 | Charlotte | 54 | 3570 | E. A. Diddle Arena | 7326 | 48.73% |
| 2/19/2016 | Summit League | Oral Roberts | 62 | Denver | 58 | 3587 | Mabee Center | 11300 | 31.74% |
| 2/18/2016 | Southern | Chattanooga | 85 | VMI | 59 | 3589 | McKenzie Arena | 10928 | 32.84% |
| 2/18/2016 | Southern | Mercer | 65 | W Carolina | 72 | 3627 | Hawkins Arena | 3500 | 103.63% |
| 2/20/2016 | Colonial Athletic | Charleston | 55 | UNC Wilmington | 59 | 3629 | TD Arena | 5100 | 71.16% |
| 2/15/2016 | Horizon League | Green Bay | 70 | Milwaukee | 68 | 3685 | Resch Center | 10200 | 36.13% |
| 2/21/2016 | Atlantic 10 | UMass | 70 | George Mason | 64 | 3691 | William D. Mullins Memorial Center | 9493 | 38.88% |
| 2/20/2016 | Summit League | North Dakota St | 63 | IUPUI | 59 | 3812 | Scheels Arena | 6000 | 63.53% |
| 2/16/2016 | Atlantic 10 | Davidson | 83 | Richmond | 79 | 3832 | John M. Belk Arena | 5223 | 73.37% |
| 2/20/2016 | Big East | USF | 80 | Memphis | 71 | 3840 | USF Sun Dome | 10411 | 36.88% |
| 2/20/2016 | Conference USA | Rice | 86 | FIU | 70 | 3859 | Tudor Fieldhouse | 5750 | 67.11% |
| 2/20/2016 | MAC | W Michigan | 92 | Cent Michigan | 85 | 3869 | University Arena (MI) | 5421 | 71.37% |
| 2/20/2016 | Southern | Mercer | 74 | ETSU | 77 | 3874 | Hawkins Arena | 3500 | 110.69% |
| 2/20/2016 | Colonial Athletic | William & Mary | 69 | Drexel | 74 | 3948 | Kaplan Arena | 8600 | 45.91% |
| 2/20/2016 | Atlantic Sun | North Florida | 81 | USC Upstate | 78 | 4086 | UNF Arena | 5800 | 70.45% |
| 2/19/2016 | Horizon League | UIC | 72 | Detroit | 83 | 4110 | UIC Pavilion | 6958 | 59.07% |
| 2/21/2016 | Horizon League | Valparaiso | 90 | Detroit | 74 | 4151 | Athletics-Recreation Center | 5000 | 83.02% |
| 2/17/2016 | Atlantic 10 | Saint Joe's | 79 | Dayton | 70 | 4200 | Hagan Arena | 4200 | 100.00% |
| 2/18/2016 | Ohio Valley | E Kentucky | 78 | Belmont | 86 | 4200 | McBrayer Arena | 6500 | 64.62% |
| 2/19/2016 | Ivy League | Princeton | 75 | Yale | 63 | 4211 | Jadwin Gymnasium | 6854 | 61.44% |
| 2/18/2016 | Atlantic Sun | FGCU | 82 | Lipscomb | 67 | 4271 | Alico Arena | 4500 | 94.91% |
| 2/16/2016 | The American | ECU | 52 | USF | 69 | 4299 | Minges Coliseum | 8000 | 53.74% |
| 2/20/2016 | Big South | Liberty | 73 | Presbyterian | 79 | 4323 | Vines Center | 8085 | 53.47% |
| 2/18/2016 | The American | Tulsa | 70 | Cincinnati | 68 | 4402 | Reynolds Center | 8355 | 52.69% |
| 2/20/2016 | Southern | The Citadel | 97 | W Carolina | 102 | 4424 | McAlister Field House | 6000 | 73.73% |
| 2/17/2016 | Missouri Valley | Illinois State | 78 | Indiana State | 50 | 4456 | Redbird Arena | 10200 | 43.69% |
| 2/21/2016 | The American | Houston | 66 | Temple | 69 | 4466 | Hofheinz Pavilion | 10000 | 44.66% |
| 2/19/2016 | MAAC | Monmouth | 67 | Iona | 83 | 4522 | Multipurpose Activity Center | 4100 | 110.29% |
| 2/18/2016 | Western Athletic | New Mexico St | 63 | CSU Bakersfield | 55 | 4550 | Pan American Center | 13071 | 34.81% |
| 2/17/2016 | America East | Albany | 82 | Stony Brook | 70 | 4578 | SEFCU Arena | 4538 | 100.88% |
| 2/20/2016 | Atlantic Sun | FGCU | 68 | Kennesaw St | 63 | 4633 | Alico Arena | 4500 | 102.96% |
| 2/20/2016 | Western Athletic | New Mexico St | 70 | Seattle | 57 | 4669 | Pan American Center | 13071 | 35.72% |
| 2/15/2016 | Horizon League | Wright State | 73 | Oakland | 89 | 4846 | Nutter Center | 10400 | 46.60% |
| 2/17/2016 | Mountain West | Wyoming | 75 | Fresno State | 79 | 4852 | Arena-Auditorium | 15028 | 32.29% |
| 2/19/2016 | Horizon League | Valparaiso | 86 | Oakland | 84 | 4863 | Athletics-Recreation Center | 5000 | 97.26% |
| 2/16/2016 | Big 12 | TCU | 49 | Kansas State | 63 | 4999 | Ed and Rae Schollmaier Arena | 7201 | 69.42% |
| 2/18/2016 | Big Sky | N Arizona | 81 | Idaho State | 68 | 5000 | J. Lawrence Walkup Skydome | 16230 | 30.81% |
| 2/17/2016 | Missouri Valley | S Illinois | 71 | Bradley | 59 | 5002 | SIU Arena | 8339 | 59.98% |
| 2/17/2016 | Big East | St John's | 80 | DePaul | 65 | 5010 | Carnesecca Arena | 5602 | 89.43% |
| 2/16/2016 | SEC | Missouri | 72 | South Carolina | 67 | 5017 | Mizzou Arena | 15061 | 33.31% |
| 2/20/2016 | MEAC | MD-E Shore | 58 | S Carolina St | 62 | 5064 | Hytche Arena | 5500 | 92.07% |
| 2/20/2016 | Ohio Valley | Belmont | 95 | Tenn Tech | 86 | 5074 | Curb Event Center | 5085 | 99.78% |
| 2/20/2016 | Atlantic 10 | URI | 77 | Duquesne | 74 | 5112 | Thomas M. Ryan Center | 7657 | 66.76% |
| 2/15/2016 | MEAC | Hampton | 87 | Morgan State | 79 | 5123 | Convocation Center (VA) | 7200 | 71.15% |
| 2/17/2016 | Pac 12 | USC | 79 | Colorado | 72 | 5132 | Galen Center | 10258 | 50.03% |
| 2/19/2016 | MAC | Ball State | 63 | N Illinois | 59 | 5160 | John E. Worthen Arena | 11500 | 44.87% |
| 2/17/2016 | Big East | Georgetown | 64 | Seton Hall | 72 | 5278 | Verizon Center | 18506 | 28.52% |
| 2/20/2016 | Atlantic 10 | Davidson | 99 | Saint Joe's | 93 | 5295 | John M. Belk Arena | 5223 | 101.38% |
| 2/20/2016 | Big Ten | Rutgers | 58 | Penn State | 70 | 5307 | Louis Brown Athletic Center | 8000 | 66.34% |
| 2/20/2016 | Ohio Valley | Austin Peay | 60 | Murray State | 76 | 5419 | Dave Aaron Arena | 9000 | 60.21% |
| 2/20/2016 | Patriot League | Navy | 78 | Army | 80 | 5510 | Alumni Hall | 5710 | 96.50% |
| 2/20/2016 | Colonial Athletic | JMU | 75 | Delaware | 50 | 5522 | JMU Convocation Center | 7156 | 77.17% |
| 2/16/2016 | Big 12 | Baylor | 100 | Iowa State | 91 | 5556 | Ferrell Center | 10347 | 53.70% |
| 2/20/2016 | Southern | Chattanooga | 64 | UNCG | 79 | 5718 | McKenzie Arena | 10928 | 52.32% |
| 2/20/2016 | Big 12 | Oklahoma State | 61 | Texas Tech | 71 | 5814 | Gallagher-Iba Arena | 13611 | 42.72% |
| 2/18/2016 | West Coast | Gonzaga | 90 | Pacific | 68 | 6000 | McCarthey Athletic Center | 6000 | 100.00% |
| 2/20/2016 | West Coast | Gonzaga | 58 | Saint Mary's | 63 | 6000 | McCarthey Athletic Center | 6000 | 100.00% |
| 2/18/2016 | Western Athletic | Grand Canyon | 78 | UMKC | 66 | 6049 | GCU Arena | 7000 | 86.41% |
| 2/20/2016 | Missouri Valley | Northern Iowa | 75 | Illinois State | 66 | 6145 | McLeod Center | 6650 | 92.41% |
| 2/18/2016 | Conference USA | Marshall | 87 | Charlotte | 72 | 6164 | Cam Henderson Center | 10705 | 57.58% |
| 2/16/2016 | SEC | Miss St | 75 | Vanderbilt | 74 | 6194 | Humphrey Coliseum | 10575 | 58.57% |
| 2/20/2016 | MEAC | Florida A&M | 54 | Bethune-Cookman | 55 | 6211 | Al Lawson Center | 8470 | 73.33% |
| 2/16/2016 | MAC | Ohio | 86 | E Michigan | 64 | 6212 | Convocation Center | 13080 | 47.49% |
| 2/17/2016 | ACC | FSU | 80 | Georgia Tech | 86 | 6217 | Donald L. Tucker Center | 12100 | 51.38% |
| 2/19/2016 | MAC | Kent State | 85 | Akron | 76 | 6327 | MAC Center | 6327 | 100.00% |
| 2/21/2016 | The American | UCF | 67 | Tulsa | 75 | 6437 | CFE Arena | 9465 | 68.01% |
| 2/16/2016 | SEC | Texas A&M | 71 | Ole Miss | 56 | 6460 | Reed Arena | 12989 | 49.73% |
| 2/20/2016 | Big East | Villanova | 77 | Butler | 67 | 6500 | The Pavilion (Villanova) | 7926 | 82.01% |
| 2/20/2016 | Big Sky | Montana | 87 | Montana State | 78 | 6522 | Dahlberg Arena | 7321 | 89.09% |
| 2/17/2016 | Big Ten | Penn State | 79 | Iowa | 75 | 6590 | Bryce Jordan Center | 15261 | 43.18% |
| 2/17/2016 | ACC | Miami (FL) | 65 | Virginia Tech | 49 | 6614 | BankUnited Center | 8000 | 82.68% |
| 2/21/2016 | The American | SMU | 74 | ECU | 63 | 6852 | Moody Coliseum | 8998 | 76.15% |
| 2/18/2016 | Conference USA | UTEP | 78 | Southern Miss | 73 | 7012 | Don Haskins Center | 12222 | 57.37% |
| 2/20/2016 | Mountain West | Colorado State | 66 | Wyoming | 84 | 7067 | Moby Arena | 8745 | 80.81% |
| 2/20/2016 | Mountain West | Fresno State | 75 | Utah State | 68 | 7068 | Save Mart Center | 15544 | 45.47% |
| 2/20/2016 | Missouri Valley | Bradley | 73 | Drake | 70 | 7149 | Carver Arena | 11164 | 64.04% |
| 2/20/2016 | Missouri Valley | Evansville | 83 | S Illinois | 71 | 7163 | Ford Center | 19164 | 37.38% |
| 2/20/2016 | Western Athletic | Grand Canyon | 67 | Chicago State | 52 | 7223 | GCU Arena | 7000 | 103.19% |
| 2/18/2016 | Pac 12 | UCLA | 73 | Utah | 75 | 7249 | Pauley Pavilion | 12829 | 56.50% |
| 2/16/2016 | Big East | Butler | 88 | Creighton | 75 | 7330 | Hinkle Fieldhouse | 15000 | 48.87% |
| 2/18/2016 | Pac 12 | Washington | 75 | Cal | 78 | 7530 | Alaska Airlines Arena | 12961 | 58.10% |
| 2/16/2016 | Atlantic 10 | VCU | 83 | URI | 67 | 7637 | Stuart C. Siegel Center | 7637 | 100.00% |
| 2/19/2016 | Atlantic 10 | VCU | 87 | Richmond | 74 | 7637 | Stuart C. Siegel Center | 7637 | 100.00% |
| 2/21/2016 | Conference USA | Mid Tennessee | 67 | UAB | 77 | 7822 | Murphy Athletic Center | 11807 | 66.25% |
| 2/20/2016 | Horizon League | Wright State | 67 | N Kentucky | 64 | 7825 | Nutter Center | 10400 | 75.24% |
| 2/21/2016 | Pac 12 | USC | 69 | Utah | 80 | 7931 | Galen Center | 10258 | 77.32% |
| 2/16/2016 | SEC | Georgia | 53 | Florida | 57 | 8021 | Stegeman Coliseum | 11200 | 71.62% |
| 2/20/2016 | SEC | Auburn | 59 | Ole Miss | 69 | 8046 | Auburn Arena | 9121 | 88.21% |
| 2/17/2016 | ACC | Clemson | 65 | Boston College | 54 | 8101 | Bon Secours Wellness Arena | 14897 | 54.38% |
| 2/20/2016 | Pac 12 | UCLA | 77 | Colorado | 53 | 8492 | Pauley Pavilion | 12829 | 66.19% |
| 2/20/2016 | Conference USA | Marshall | 82 | Old Dominion | 65 | 8520 | Cam Henderson Center | 10705 | 79.59% |
| 2/20/2016 | Big East | DePaul | 60 | Marquette | 73 | 8524 | Allstate Arena | 17500 | 48.71% |
| 2/21/2016 | ACC | Wake Forest | 74 | Boston College | 48 | 8542 | Lawrence Joel Coliseum | 14665 | 58.25% |
| 2/20/2016 | Atlantic 10 | Saint Louis | 76 | Fordham | 68 | 8591 | Chaifetz Arena | 10600 | 81.05% |
| 2/20/2016 | ACC | Georgia Tech | 63 | Notre Dame | 62 | 8600 | McCamish Pavilion | 9191 | 93.57% |
| 2/16/2016 | ACC | Pitt | 101 | Wake Forest | 96 | 8825 | Petersen Events Center | 12508 | 70.55% |
| 2/20/2016 | MAC | Ohio | 76 | Miami (OH) | 64 | 9018 | Convocation Center | 13080 | 68.94% |
| 2/20/2016 | Pac 12 | Washington | 64 | Stanford | 53 | 9161 | Alaska Airlines Arena | 12961 | 70.68% |
| 2/17/2016 | Mountain West | Utah State | 72 | Colorado State | 59 | 9377 | Dee Glen Smith Spectrum | 10270 | 91.30% |
| 2/20/2016 | ACC | Virginia Tech | 83 | FSU | 73 | 9567 | Cassell Coliseum | 9847 | 97.16% |
| 2/17/2016 | Big East | Xavier | 85 | Providence | 74 | 10336 | Cintas Center | 10250 | 100.84% |
| 2/17/2016 | The American | Temple | 67 | Villanova | 83 | 10472 | Liacouras Center | 10206 | 102.61% |
| 2/15/2016 | Missouri Valley | Wichita State | 71 | New Mexico St | 41 | 10506 | Charles Koch Arena | 10506 | 100.00% |
| 2/18/2016 | Missouri Valley | Wichita State | 99 | Missouri State | 68 | 10506 | Charles Koch Arena | 10506 | 100.00% |
| 2/20/2016 | Big East | Georgetown | 70 | Xavier | 88 | 10652 | Verizon Center | 18506 | 57.56% |
| 2/17/2016 | SEC | LSU | 69 | Alabama | 76 | 10703 | Pete Maravich Assembly Center | 14351 | 74.58% |
| 2/18/2016 | Big Ten | Minnesota | 68 | Maryland | 63 | 10768 | Williams Arena | 14625 | 73.63% |
| 2/16/2016 | Big Ten | Illinois | 82 | Rutgers | 66 | 11323 | State Farm Center | 15500 | 73.05% |
| 2/20/2016 | SEC | Vanderbilt | 80 | Georgia | 67 | 11745 | Memorial Gymnasium (Vandy) | 15626 | 75.16% |
| 2/20/2016 | SEC | Texas A&M | 79 | Kentucky | 77 | 12029 | Reed Arena | 12989 | 92.61% |
| 2/16/2016 | Big 12 | Texas | 85 | West Virginia | 78 | 12284 | Frank Erwin Center | 16837 | 72.96% |
| 2/20/2016 | Pac 12 | Oregon | 91 | Oregon State | 81 | 12364 | Matthew Knight Arena | 12369 | 99.96% |
| 2/17/2016 | Mountain West | New Mexico | 80 | Boise State | 78 | 12434 | WisePies Arena | 15411 | 80.68% |
| 2/17/2016 | The American | Memphis | 73 | UCF | 56 | 12492 | FedExForum | 18119 | 68.94% |
| 2/20/2016 | Big 12 | Kansas State | 63 | Kansas | 72 | 12528 | Bramlage Coliseum | 13762 | 91.03% |
| 2/16/2016 | Big Ten | Purdue | 71 | Northwestern | 61 | 12868 | Mackey Arena | 14846 | 86.68% |
| 2/20/2016 | Big East | Cincinnati | 65 | UConn | 60 | 13176 | Fifth Third Arena | 13176 | 100.00% |
| 2/21/2016 | Big East | St John's | 61 | Seton Hall | 62 | 13204 | Madison Square Garden | 19812 | 66.65% |
| 2/20/2016 | Atlantic 10 | Dayton | 72 | St Bonaventure | 79 | 13455 | University of Dayton Arena | 13435 | 100.15% |
| 2/15/2016 | ACC | UVA | 73 | NC State | 53 | 14016 | John Paul Jones Arena | 14593 | 96.05% |
| 2/17/2016 | SEC | Arkansas | 86 | Auburn | 90 | 14351 | Bud Walton Arena | 20320 | 70.63% |
| 2/20/2016 | Big 12 | Iowa State | 92 | TCU | 83 | 14384 | Hilton Coliseum | 14356 | 100.20% |
| 2/17/2016 | Big 12 | Texas Tech | 65 | Oklahoma | 63 | 14471 | United Supermarkets Arena | 15020 | 96.34% |
| 2/20/2016 | Mountain West | UNLV | 102 | Nevada | 91 | 14640 | Thomas & Mack Center | 18776 | 77.97% |
| 2/17/2016 | Pac 12 | Arizona | 99 | Arizona State | 61 | 14644 | McKale Center | 14545 | 100.68% |
| 2/18/2016 | Big Ten | Michigan State | 69 | Wisconsin | 57 | 14797 | Breslin Center | 16280 | 90.89% |
| 2/20/2016 | Big 12 | West Virginia | 62 | Oklahoma | 76 | 15289 | WVU Coliseum | 14000 | 109.21% |
| 2/20/2016 | SEC | Alabama | 61 | Miss St | 67 | 15383 | Coleman Coliseum | 15383 | 100.00% |
| 2/18/2016 | Big East | UConn | 68 | SMU | 62 | 15564 | XL Center | 15564 | 100.00% |
| 2/20/2016 | Big Ten | Nebraska | 62 | OSU | 65 | 15679 | Pinnacle Bank Arena | 15147 | 103.51% |
| 2/15/2016 | Big 12 | Kansas | 94 | Oklahoma State | 67 | 16300 | Allen Fieldhouse | 16300 | 100.00% |
| 2/20/2016 | West Coast | BYU | 91 | San Diego | 33 | 16324 | Marriott Center | 22700 | 71.91% |
| 2/20/2016 | Big 12 | Texas | 64 | Baylor | 78 | 16540 | Frank Erwin Center | 16837 | 98.24% |
| 2/20/2016 | SEC | Arkansas | 84 | Missouri | 72 | 16617 | Bud Walton Arena | 20320 | 81.78% |
| 2/16/2016 | Big Ten | OSU | 76 | Michigan | 66 | 17088 | Value City Arena | 18809 | 90.85% |
| 2/21/2016 | Big Ten | Wisconsin | 69 | Illinois | 60 | 17287 | Kohl Center | 17230 | 100.33% |
| 2/17/2016 | Big Ten | Indiana | 80 | Nebraska | 64 | 17472 | Assembly Hall (Indiana) | 17472 | 100.00% |
| 2/20/2016 | Big Ten | Indiana | 77 | Purdue | 73 | 17472 | Assembly Hall (Indiana) | 17472 | 100.00% |
| 2/20/2016 | ACC | NC State | 77 | Clemson | 74 | 17536 | PNC Arena | 18680 | 93.88% |
| 2/21/2016 | Big Ten | Maryland | 86 | Michigan | 82 | 17950 | XFINITY Center | 17950 | 100.00% |
| 2/20/2016 | SEC | South Carolina | 73 | Florida | 69 | 18000 | Colonial Life Arena | 18000 | 100.00% |
| 2/20/2016 | SEC | Tennessee | 81 | LSU | 65 | 19721 | Thompson-Boling Arena | 21678 | 90.97% |
| 2/20/2016 | ACC | UNC | 96 | Miami (FL) | 71 | 20151 | Dean E. Smith Center | 21750 | 92.65% |
| 2/17/2016 | ACC | Louisville | 72 | Syracuse | 58 | 21654 | KFC Yum! Center | 22090 | 98.03% |
| 2/17/2016 | ACC | UNC | 73 | Duke | 74 | 21750 | Dean E. Smith Center | 21750 | 100.00% |
| 2/20/2016 | ACC | Louisville | 71 | Duke | 64 | 22785 | KFC Yum! Center | 22090 | 103.15% |
| 2/18/2016 | SEC | Kentucky | 80 | Tennessee | 70 | 24274 | Rupp Arena | 23500 | 103.29% |
| 2/20/2016 | ACC | Syracuse | 52 | Pitt | 66 | 28696 | Carrier Dome | 35446 | 80.96% |