As we inch closer and closer to March, the haves and have-nots begin to separate, and we start to see attendance diverge. This week, as in last week, had quite a few games below 1,000 in attendance, but at the top, quite a few high attendance games have floated the average attendance up almost 6% this week. Let’s take a look:
Number of games drawing fewer than 1,000 fans: 34
Here are the 3 lowest attended games of last week:
3. USC Upstate vs Florida Gulf Coast University – Despite being DUNK CITY, FGCU wasn’t much of a draw for fans of the USC Upstate Spartans, who currently stand at the bottom of the Atlantic Sun conference. The middle-of-the-Atlantic-Sun-pack Eagles took home the victory in front of 345 fans. Factoring in that USC Upstate’s basketball arena has a capacity of only 878, this one doesn’t seem quite as bad.
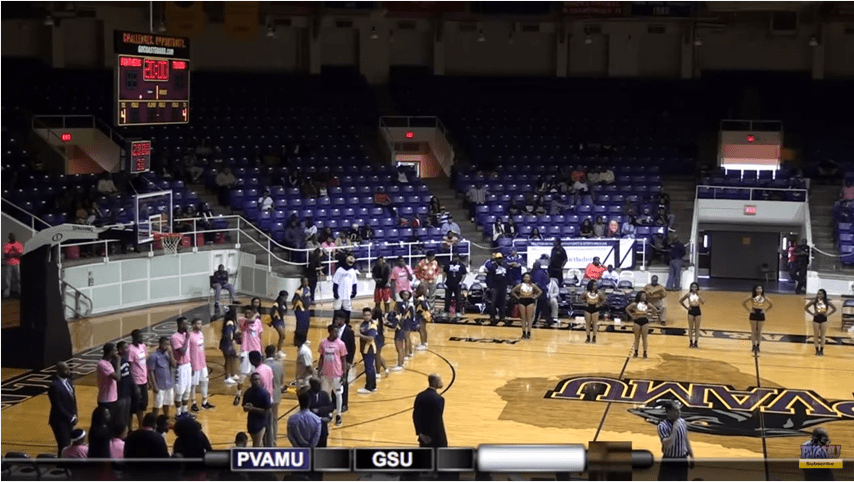
2. Prairie View A&M vs Grambling State – MEANWHILE, IN THE SWAC. What is often one of the nation’s worst conferences, only two teams sit above .500 in the SWAC this year. Neither of those teams are Prairie View A&M or Grambling State. Both PV and Grambling teams sit at the bottom of an already awful conference, so it’s no surprise that only 313 were on hand to see the Panthers of Prairie View A&M jump out of last place in the conference with the win, their 3rd of the season. Generations from now, those 313 will tell their grandchildren that they were there for this pivotal moment in PVA&M basketball history. Since Prairie View A&M is kind enough to stream all their games on Youtube, here’s a shot of the crowd at tipoff:
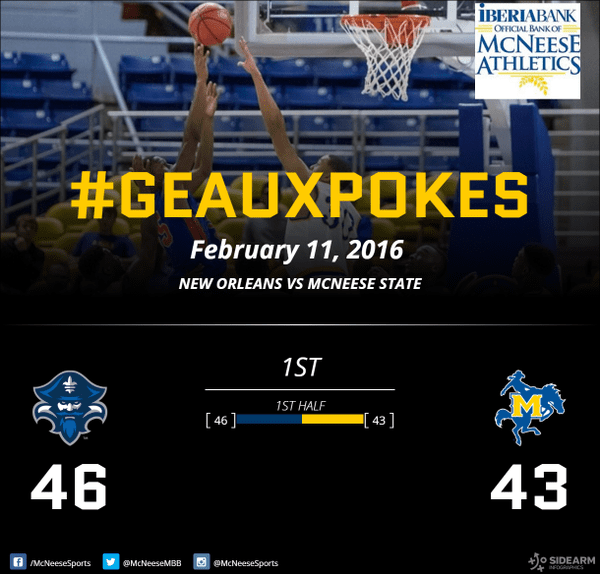
1. McNeese State vs New Orleans – Not to be outdone by their neighbors 188 miles west, McNeese State once again appears at the bottom of this list, only putting 302 butts in 8,500 seats against New Orleans. Never one to miss an opportunity, this gives me the chance to once again point out that McNeese State may have the ugliest arena in all of college basketball. I won’t even tell you about the city of Lake Charles itself. Luckily, the home fans were given something to live for as the Cowboys took the win 87-76, putting McNeese State tied for 10th in the Southland. New Orleans sits a half game ahead in a three way tie for 7th. On the Twitter dot com, they’re not even pretending to have fans:
As always, the miscellany:
Biggest group of people to see a loss at home this week: South Carolina (vs Kentucky) 18,000.
Smallest group of people to see a win at home this week: McNeese State (vs New Orleans), 302.
Smallest Power Conference attendance: Oklahoma State (vs Kansas State), 4,407.
Average attendance this week: 4,816 (up 256 (5.6%) over last week)
And as always, your full attendance numbers for the week:
| Date | Conference | Home Team | Home Score | Away Team | Away Score | Attendance | Venue | Capacity | % full |
|---|---|---|---|---|---|---|---|---|---|
| 2/11/2016 | Southland | McNeese State | 87 | New Orleans | 76 | 302 | Burton Coliseum | 6500 | 4.65% |
| 2/13/2016 | SWAC | PV A&M | 60 | Grambling St | 56 | 313 | William Nicks Building | 6500 | 4.82% |
| 2/11/2016 | Atlantic Sun | USC Upstate | 64 | FGCU | 71 | 345 | Hodge Center | 878 | 39.29% |
| 2/12/2016 | MAAC | St Peter’s | 72 | Niagara | 59 | 346 | Yanitelli Center | 3200 | 10.81% |
| 2/14/2016 | MAAC | St Peter’s | 61 | Canisius | 57 | 348 | Yanitelli Center | 3200 | 10.88% |
| 2/11/2016 | Northeast | St Francis (BKN) | 74 | Cent Conn St | 67 | 355 | Pope Physical Education Center | 2000 | 17.75% |
| 2/8/2016 | America East | UNH | 88 | Maine | 75 | 365 | Lundholm Gymnasium | 6501 | 5.61% |
| 2/13/2016 | Northeast | Bryant | 55 | Wagner | 79 | 427 | Chace Athletic Center | 2700 | 15.81% |
| 2/8/2016 | America East | UMass Lowell | 100 | Vermont | 93 | 437 | Costello Athletic Center | 2100 | 20.81% |
| 2/13/2016 | MEAC | S Carolina St | 57 | Savannah State | 60 | 469 | S-H-M Memorial Center | 3200 | 14.66% |
| 2/8/2016 | Patriot League | Army | 82 | Colgate | 72 | 486 | Christl Arena | 5043 | 9.64% |
| 2/14/2016 | America East | UMass Lowell | 96 | UMBC | 92 | 491 | Costello Athletic Center | 2100 | 23.38% |
| 2/10/2016 | Patriot League | Boston U | 71 | American U | 51 | 503 | Case Gym | 1800 | 27.94% |
| 2/9/2016 | Southland | Cent Arkansas | 88 | SE Louisiana | 72 | 513 | Farris Center | 6000 | 8.55% |
| 2/13/2016 | Big South | Presbyterian | 61 | Campbell | 91 | 519 | Ross E. Templeton P.E. Center | 2300 | 22.57% |
| 2/8/2016 | Southland | Nicholls State | 71 | Incarnate Word | 60 | 561 | Stopher Gymnasium | 3800 | 14.76% |
| 2/13/2016 | SWAC | Southern | 66 | AR-Pine Bluff | 58 | 623 | F. G. Clark Activity Center | 7500 | 8.31% |
| 2/13/2016 | Big West | UC Riverside | 78 | Cal Poly | 86 | 625 | SRC Arena | 3168 | 19.73% |
| 2/10/2016 | Patriot League | Loyola (MD) | 51 | Navy | 71 | 637 | Reitz Arena | 3000 | 21.23% |
| 2/13/2016 | Patriot League | Loyola (MD) | 65 | Boston U | 73 | 647 | Reitz Arena | 3000 | 21.57% |
| 2/11/2016 | Big South | Charleston So | 77 | Presbyterian | 63 | 686 | CSU Field House | 881 | 77.87% |
| 2/11/2016 | Northeast | Bryant | 77 | Fair Dickinson | 91 | 689 | Chace Athletic Center | 2700 | 25.52% |
| 2/8/2016 | SWAC | Miss Valley St | 66 | Alabama A&M | 64 | 762 | Leflore County Civic Center | 1801 | 42.31% |
| 2/13/2016 | Southland | SE Louisiana | 69 | Nicholls State | 61 | 768 | University Center (LA) | 7500 | 10.24% |
| 2/13/2016 | Ivy League | Dartmouth | 87 | Brown | 70 | 777 | Edward Leede Arena | 2100 | 37.00% |
| 2/12/2016 | Ivy League | Dartmouth | 65 | Yale | 75 | 787 | Edward Leede Arena | 2100 | 37.48% |
| 2/11/2016 | Atlantic Sun | NJIT | 74 | Stetson | 70 | 805 | Fleisher Center | 1500 | 53.67% |
| 2/13/2016 | Western Athletic | Chicago State | 55 | New Mexico St | 69 | 813 | Jones Convocation Center | 7000 | 11.61% |
| 2/8/2016 | SWAC | Grambling St | 63 | Alcorn State | 66 | 821 | Fredrick C. Hobdy Assembly Center | 7500 | 10.95% |
| 2/12/2016 | Southland | Incarnate Word | 71 | Cent Arkansas | 69 | 827 | McDermott Convocation Center | 2000 | 41.35% |
| 2/11/2016 | America East | UNH | 69 | Albany | 68 | 843 | Lundholm Gymnasium | 6501 | 12.97% |
| 2/11/2016 | Conference USA | FAU | 79 | UTSA | 73 | 933 | FAU Arena | 5000 | 18.66% |
| 2/11/2016 | Conference USA | FIU | 74 | UTEP | 84 | 936 | FIU Arena | 6000 | 15.60% |
| 2/8/2016 | SWAC | AR-Pine Bluff | 75 | Alabama State | 70 | 981 | H. O. Clemmons Arena | 4500 | 21.80% |
| 2/11/2016 | MAAC | Manhattan | 84 | Quinnipiac | 77 | 1004 | Draddy Gymnasium | 2345 | 42.81% |
| 2/11/2016 | Big South | Winthrop | 88 | Longwood | 80 | 1012 | Winthrop Coliseum | 6100 | 16.59% |
| 2/11/2016 | Big Sky | Idaho | 73 | N Colorado | 67 | 1012 | Cowan Spectrum | 7000 | 14.46% |
| 2/8/2016 | Southland | Texas A&M-CC | 83 | Houston Baptist | 76 | 1038 | American Bank Center | 10000 | 10.38% |
| 2/13/2016 | MAC | E Michigan | 75 | Kent State | 70 | 1059 | Convocation Center (MI) | 8824 | 12.00% |
| 2/13/2016 | Conference USA | FIU | 79 | UTSA | 65 | 1062 | FIU Arena | 6000 | 17.70% |
| 2/13/2016 | MEAC | NC A&T | 75 | Florida A&M | 68 | 1063 | Corbett Sports Center | 5700 | 18.65% |
| 2/10/2016 | Patriot League | Holy Cross | 67 | Lafayette | 53 | 1067 | Hart Center | 3600 | 29.64% |
| 2/8/2016 | Southern | Furman | 79 | UNCG | 72 | 1110 | Timmons Arena | 4000 | 27.75% |
| 2/10/2016 | Big West | CS Northridge | 75 | CS Fullerton | 67 | 1127 | Matadome | 3106 | 36.28% |
| 2/8/2016 | Southern | Wofford | 92 | VMI | 60 | 1129 | Benjamin Johnson Arena | 3500 | 32.26% |
| 2/11/2016 | Atlantic Sun | Kennesaw St | 101 | North Florida | 91 | 1158 | KSU Convocation Center | 4792 | 24.17% |
| 2/13/2016 | Southland | Sam Houston | 80 | Houston Baptist | 68 | 1172 | Bernard G. Johnson Coliseum | 6110 | 19.18% |
| 2/11/2016 | Atlantic Sun | Lipscomb | 93 | Jacksonville | 92 | 1175 | Allen Arena | 5028 | 23.37% |
| 2/13/2016 | MEAC | Coppin State | 90 | Howard | 66 | 1200 | Physical Education Complex | 4100 | 29.27% |
| 2/13/2016 | Atlantic Sun | NJIT | 68 | FGCU | 59 | 1203 | Fleisher Center | 1500 | 80.20% |
| 2/8/2016 | MEAC | Savannah State | 72 | Coppin State | 63 | 1211 | Tiger Arena | 6000 | 20.18% |
| 2/9/2016 | MAC | E Michigan | 71 | Cent Michigan | 56 | 1233 | Convocation Center (MI) | 8824 | 13.97% |
| 2/13/2016 | Ivy League | Cornell | 84 | Penn | 92 | 1237 | Newman Arena | 4473 | 27.65% |
| 2/13/2016 | Colonial Athletic | Northeastern | 70 | Drexel | 60 | 1238 | Matthews Arena | 6000 | 20.63% |
| 2/11/2016 | America East | UMBC | 52 | Stony Brook | 75 | 1247 | Retriever Activities Center | 4024 | 30.99% |
| 2/13/2016 | Summit League | IPFW | 88 | Denver | 84 | 1248 | Allen County War Memorial Coliseum | 13000 | 9.60% |
| 2/13/2016 | Conference USA | FAU | 82 | UTEP | 89 | 1254 | FAU Arena | 5000 | 25.08% |
| 2/11/2016 | Sun Belt | Troy | 71 | Ga Southern | 77 | 1326 | Trojan Arena | 4000 | 33.15% |
| 2/11/2016 | America East | Hartford | 54 | Binghamton | 68 | 1330 | Chase Arena | 4107 | 32.38% |
| 2/13/2016 | Patriot League | American U | 59 | Army | 65 | 1342 | Bender Arena | 4500 | 29.82% |
| 2/12/2016 | Ivy League | Cornell | 56 | Princeton | 85 | 1344 | Newman Arena | 4473 | 30.05% |
| 2/13/2016 | West Coast | San Francisco | 68 | San Diego | 51 | 1358 | War Memorial Gymnasium | 5300 | 25.62% |
| 2/13/2016 | MEAC | NC Central | 90 | Bethune-Cookman | 66 | 1362 | McDougald-McLendon Gymnasium | 3056 | 44.57% |
| 2/8/2016 | SWAC | Jackson State | 81 | Southern | 80 | 1391 | Lee E. Williams Athletic and Assembly Center | 8000 | 17.39% |
| 2/13/2016 | Northeast | Fair Dickinson | 70 | Robert Morris | 72 | 1411 | Rothman Center | 5000 | 28.22% |
| 2/14/2016 | MAAC | Rider | 77 | Niagara | 59 | 1414 | Alumni Gymnasium (Rider) | 1650 | 85.70% |
| 2/11/2016 | West Coast | San Francisco | 89 | BYU | 114 | 1420 | War Memorial Gymnasium | 5300 | 26.79% |
| 2/11/2016 | Summit League | Denver | 60 | W Illinois | 63 | 1425 | Magness Arena | 7200 | 19.79% |
| 2/11/2016 | West Coast | Santa Clara | 74 | San Diego | 71 | 1428 | Leavey Center | 5000 | 28.56% |
| 2/13/2016 | Sun Belt | Troy | 54 | Georgia State | 53 | 1436 | Trojan Arena | 4000 | 35.90% |
| 2/11/2016 | Big South | Campbell | 89 | Gardner-Webb | 85 | 1437 | Pope Convocation Center | 3095 | 46.43% |
| 2/13/2016 | Ohio Valley | E Illinois | 64 | SIU ED | 72 | 1469 | Lantz Arena | 5300 | 27.72% |
| 2/11/2016 | Northeast | LIU Brooklyn | 82 | Wagner | 69 | 1475 | Wellness | 2500 | 59.00% |
| 2/13/2016 | MAAC | Marist | 73 | Manhattan | 81 | 1477 | McCann Arena | 3200 | 46.16% |
| 2/8/2016 | MEAC | Florida A&M | 96 | Delaware State | 95 | 1492 | Al Lawson Center | 8470 | 17.62% |
| 2/11/2016 | Ohio Valley | UT Martin | 77 | SE Missouri St | 64 | 1497 | Skyhawk Arena | 5000 | 29.94% |
| 2/11/2016 | America East | Maine | 95 | UMass Lowell | 108 | 1523 | Cross Insurance Center | 5800 | 26.26% |
| 2/13/2016 | Big Sky | Idaho | 65 | North Dakota | 64 | 1537 | Cowan Spectrum | 7000 | 21.96% |
| 2/11/2016 | Big South | UNC Asheville | 59 | Radford | 60 | 1547 | Kimmel Arena | 3200 | 48.34% |
| 2/9/2016 | MAC | Bowling Green | 68 | Akron | 83 | 1554 | Stroh Center | 4700 | 33.06% |
| 2/11/2016 | Colonial Athletic | Towson | 44 | Northeastern | 47 | 1578 | SECU Arena | 5250 | 30.06% |
| 2/11/2016 | Northeast | Robert Morris | 57 | St Francis (PA) | 68 | 1591 | Charles L. Sewall Center | 3056 | 52.06% |
| 2/11/2016 | Summit League | South Dakota | 72 | North Dakota St | 58 | 1595 | The DakotaDome | 10000 | 15.95% |
| 2/11/2016 | Southern | Furman | 95 | The Citadel | 75 | 1606 | Timmons Arena | 4000 | 40.15% |
| 2/9/2016 | MAAC | Marist | 61 | Monmouth | 87 | 1648 | McCann Arena | 3200 | 51.50% |
| 2/11/2016 | Big Sky | E Washington | 95 | North Dakota | 85 | 1650 | Reese Court | 6000 | 27.50% |
| 2/12/2016 | MAAC | Rider | 78 | Monmouth | 79 | 1650 | Alumni Gymnasium (Rider) | 1650 | 100.00% |
| 2/13/2016 | Western Athletic | UMKC | 75 | UT Rio Grande | 58 | 1670 | Municipal Auditorium (MO) | 7300 | 22.88% |
| 2/13/2016 | Big Sky | E Washington | 97 | N Colorado | 80 | 1689 | Reese Court | 6000 | 28.15% |
| 2/12/2016 | Ivy League | Harvard | 79 | Brown | 73 | 1712 | Lavietes Pavilion | 2195 | 78.00% |
| 2/8/2016 | Southern | The Citadel | 86 | Samford | 95 | 1742 | McAlister Field House | 6000 | 29.03% |
| 2/8/2016 | Southland | Lamar | 67 | Abil Christian | 71 | 1743 | Montagne Center | 10080 | 17.29% |
| 2/13/2016 | Big South | High Point | 72 | Charleston So | 50 | 1750 | Millis Athletic Center | 1750 | 100.00% |
| 2/13/2016 | Western Athletic | CSU Bakersfield | 91 | Utah Valley | 69 | 1765 | Icardo Center | 3800 | 46.45% |
| 2/10/2016 | Ohio Valley | E Illinois | 70 | Austin Peay | 79 | 1771 | Lantz Arena | 5300 | 33.42% |
| 2/13/2016 | The American | Tulane | 94 | Memphis | 87 | 1793 | Devlin Fieldhouse | 3600 | 49.81% |
| 2/10/2016 | Ohio Valley | Belmont | 81 | Jacksonville St | 73 | 1828 | Curb Event Center | 5085 | 35.95% |
| 2/13/2016 | Southland | Northwestern St | 87 | McNeese State | 78 | 1837 | Prather Coliseum | 3900 | 47.10% |
| 2/8/2016 | Patriot League | Lafayette | 72 | Lehigh | 87 | 1844 | Kirby Sports Center | 4000 | 46.10% |
| 2/13/2016 | Big South | Longwood | 68 | Liberty | 69 | 1900 | Willett Hall | 2522 | 75.34% |
| 2/13/2016 | Patriot League | Lafayette | 68 | Navy | 74 | 1932 | Kirby Sports Center | 4000 | 48.30% |
| 2/13/2016 | Big Sky | Idaho State | 66 | Sacramento St | 64 | 1941 | Holt Arena | 8000 | 24.26% |
| 2/11/2016 | Colonial Athletic | Delaware | 69 | Drexel | 60 | 1946 | Bob Carpenter Center | 5000 | 38.92% |
| 2/11/2016 | Sun Belt | South Alabama | 79 | Georgia State | 78 | 1956 | Mitchell Center | 10041 | 19.48% |
| 2/11/2016 | Southern | W Carolina | 67 | Chattanooga | 61 | 1982 | Ramsey Center | 7826 | 25.33% |
| 2/13/2016 | MEAC | Delaware State | 75 | MD-E Shore | 71 | 1983 | Memorial Hall (Dover | 3000 | 66.10% |
| 2/11/2016 | Ohio Valley | SIU ED | 64 | Murray State | 70 | 2007 | Vadalabene Center | 4157 | 48.28% |
| 2/13/2016 | Big South | Radford | 84 | Winthrop | 86 | 2012 | Donald N. Dedmon Center | 3205 | 62.78% |
| 2/11/2016 | Northeast | Mt St Mary’s | 66 | Sacred Heart | 61 | 2014 | Knott Arena | 3121 | 64.53% |
| 2/10/2016 | Atlantic 10 | Fordham | 72 | St Bonaventure | 76 | 2021 | Rose Hill Gymnasium | 3470 | 58.24% |
| 2/11/2016 | Southern | Wofford | 79 | Mercer | 70 | 2023 | Benjamin Johnson Arena | 3500 | 57.80% |
| 2/13/2016 | MAAC | Quinnipiac | 80 | Fairfield | 84 | 2034 | TD Bank Sports Center | 3570 | 56.97% |
| 2/13/2016 | Sun Belt | UT-Arlington | 91 | Appalachian St | 60 | 2141 | College Park Center | 7000 | 30.59% |
| 2/13/2016 | Big South | Coast Carolina | 78 | Gardner-Webb | 71 | 2157 | The HTC Center | 3212 | 67.15% |
| 2/11/2016 | West Coast | Pacific | 72 | Loyola Mary | 77 | 2190 | Alex G. Spanos Center | 6150 | 35.61% |
| 2/13/2016 | Ivy League | Harvard | 55 | Yale | 67 | 2195 | Lavietes Pavilion | 2195 | 100.00% |
| 2/11/2016 | Big West | UC Davis | 66 | UCSB | 72 | 2205 | The Pavilion (UC Davis) | 7926 | 27.82% |
| 2/13/2016 | Atlantic Sun | Lipscomb | 94 | North Florida | 87 | 2219 | Allen Arena | 5028 | 44.13% |
| 2/14/2016 | Missouri Valley | Loyola (CHI) | 73 | Evansville | 74 | 2257 | Joseph J. Gentile Center | 4486 | 50.31% |
| 2/11/2016 | Big Sky | Montana State | 101 | N Arizona | 58 | 2275 | Brick Breeden Fieldhouse | 7250 | 31.38% |
| 2/13/2016 | Sun Belt | South Alabama | 80 | Ga Southern | 76 | 2296 | Mitchell Center | 10041 | 22.87% |
| 2/8/2016 | Western Athletic | New Mexico St | 85 | Northern New Mexico | 54 | 2306 | SANTA ANA STAR CENTER | 7000 | 32.94% |
| 2/11/2016 | Horizon League | Detroit | 85 | Green Bay | 86 | 2311 | Calihan Hall | 8295 | 27.86% |
| 2/11/2016 | Horizon League | Valparaiso | 64 | N Kentucky | 52 | 2312 | Athletics-Recreation Center | 5000 | 46.24% |
| 2/13/2016 | Colonial Athletic | Towson | 99 | William & Mary | 82 | 2334 | SECU Arena | 5250 | 44.46% |
| 2/14/2016 | Atlantic 10 | Duquesne | 99 | UMass | 108 | 2364 | A.J. Palumbo Center | 4406 | 53.65% |
| 2/13/2016 | Southern | Furman | 85 | Mercer | 74 | 2368 | Timmons Arena | 4000 | 59.20% |
| 2/11/2016 | Sun Belt | Texas State | 69 | Appalachian St | 68 | 2375 | Strahan Coliseum | 7200 | 32.99% |
| 2/11/2016 | Big South | Coast Carolina | 67 | High Point | 68 | 2395 | The HTC Center | 3212 | 74.56% |
| 2/13/2016 | Southern | Wofford | 99 | The Citadel | 89 | 2430 | Benjamin Johnson Arena | 3500 | 69.43% |
| 2/13/2016 | West Coast | Santa Clara | 62 | BYU | 96 | 2469 | Leavey Center | 5000 | 49.38% |
| 2/14/2016 | America East | Vermont | 92 | Hartford | 81 | 2475 | Patrick Gymnasium | 3228 | 76.67% |
| 2/13/2016 | Big West | UC Irvine | 93 | CS Northridge | 84 | 2486 | Bren Events Center | 4984 | 49.88% |
| 2/12/2016 | Ivy League | Columbia | 63 | Penn | 53 | 2505 | Levien Gymnasium | 3408 | 73.50% |
| 2/10/2016 | Patriot League | Bucknell | 65 | Lehigh | 80 | 2523 | Sojka Pavilion | 4000 | 63.08% |
| 2/13/2016 | Southern | W Carolina | 76 | Samford | 71 | 2531 | Ramsey Center | 7826 | 32.34% |
| 2/12/2016 | Western Athletic | Seattle | 60 | Grand Canyon | 71 | 2546 | KeyArena | 17072 | 14.91% |
| 2/10/2016 | Ohio Valley | Tennessee St | 85 | Tenn Tech | 55 | 2554 | Gentry Center | 10500 | 24.32% |
| 2/13/2016 | MEAC | Norfolk State | 79 | Morgan State | 73 | 2561 | Echols Hall | 7000 | 36.59% |
| 2/13/2016 | Ohio Valley | Austin Peay | 84 | UT Martin | 85 | 2599 | Dave Aaron Arena | 9000 | 28.88% |
| 2/11/2016 | Big Sky | Idaho State | 88 | Portland State | 71 | 2602 | Holt Arena | 8000 | 32.53% |
| 2/13/2016 | MAAC | Iona | 78 | Siena | 81 | 2611 | Hynes Athletics Center | 2611 | 100.00% |
| 2/13/2016 | Colonial Athletic | Delaware | 66 | Hofstra | 77 | 2622 | Bob Carpenter Center | 5000 | 52.44% |
| 2/13/2016 | Big Sky | Montana State | 80 | Southern Utah | 73 | 2624 | Brick Breeden Fieldhouse | 7250 | 36.19% |
| 2/13/2016 | West Coast | Pacific | 63 | Pepperdine | 65 | 2626 | Alex G. Spanos Center | 6150 | 42.70% |
| 2/11/2016 | Big West | LBSU | 73 | Cal Poly | 70 | 2627 | Walter Pyramid | 5000 | 52.54% |
| 2/11/2016 | Horizon League | UIC | 64 | Wright State | 59 | 2633 | UIC Pavilion | 6958 | 37.84% |
| 2/13/2016 | Ivy League | Columbia | 83 | Princeton | 88 | 2633 | Levien Gymnasium | 3408 | 77.26% |
| 2/13/2016 | SWAC | Texas Southern | 76 | Jackson State | 60 | 2642 | H&PE Arena | 8100 | 32.62% |
| 2/13/2016 | Horizon League | UIC | 79 | N Kentucky | 77 | 2666 | UIC Pavilion | 6958 | 38.32% |
| 2/11/2016 | Atlantic 10 | UMass | 69 | VCU | 63 | 2698 | William D. Mullins Memorial Center | 9493 | 28.42% |
| 2/8/2016 | MEAC | Howard | 65 | Hampton | 68 | 2700 | Burr Gymnasium | 2700 | 100.00% |
| 2/13/2016 | Ohio Valley | E Kentucky | 78 | Tennessee St | 79 | 2700 | McBrayer Arena | 6500 | 41.54% |
| 2/12/2016 | MAC | Buffalo | 75 | Ohio | 94 | 2702 | Alumni Arena | 6100 | 44.30% |
| 2/9/2016 | MAC | Buffalo | 69 | Toledo | 71 | 2706 | Alumni Arena | 6100 | 44.36% |
| 2/14/2016 | America East | Albany | 108 | Maine | 64 | 2716 | SEFCU Arena | 4538 | 59.85% |
| 2/9/2016 | MAC | Kent State | 75 | N Illinois | 74 | 2764 | MAC Center | 6327 | 43.69% |
| 2/8/2016 | MEAC | MD-E Shore | 70 | Norfolk State | 76 | 2810 | Hytche Arena | 5500 | 51.09% |
| 2/13/2016 | Big West | UC Davis | 48 | LBSU | 57 | 2829 | The Pavilion (UC Davis) | 7926 | 35.69% |
| 2/10/2016 | Summit League | Omaha | 96 | South Dakota St | 92 | 2838 | Baxter Arena | 7500 | 37.84% |
| 2/11/2016 | Conference USA | Southern Miss | 77 | UAB | 80 | 2895 | Reed Green Coliseum | 8095 | 35.76% |
| 2/13/2016 | Conference USA | Southern Miss | 54 | Mid Tennessee | 76 | 2917 | Reed Green Coliseum | 8095 | 36.03% |
| 2/11/2016 | Southern | ETSU | 94 | Samford | 90 | 2945 | Freedom Hall Civic Center | 5619 | 52.41% |
| 2/11/2016 | Summit League | Oral Roberts | 77 | IUPUI | 56 | 2995 | Mabee Center | 11300 | 26.50% |
| 2/13/2016 | Horizon League | Youngstown St | 59 | Cleveland State | 64 | 2996 | Beeghly Center | 6500 | 46.09% |
| 2/8/2016 | America East | Stony Brook | 85 | Hartford | 72 | 3001 | Island Federal Credit Union Arena | 4000 | 75.03% |
| 2/11/2016 | Colonial Athletic | Charleston | 52 | JMU | 56 | 3023 | TD Arena | 5100 | 59.27% |
| 2/10/2016 | Mountain West | Colorado State | 97 | Boise State | 93 | 3067 | Moby Arena | 8745 | 35.07% |
| 2/10/2016 | Atlantic 10 | G Washington | 66 | Saint Joe’s | 84 | 3091 | Charles E. Smith Center | 4338 | 71.25% |
| 2/9/2016 | MAC | Ball State | 69 | Ohio | 72 | 3100 | John E. Worthen Arena | 11500 | 26.96% |
| 2/13/2016 | Northeast | Mt St Mary’s | 66 | St Francis (PA) | 61 | 3121 | Knott Arena | 3121 | 100.00% |
| 2/11/2016 | Conference USA | Charlotte | 102 | Rice | 73 | 3127 | Halton Arena | 9105 | 34.34% |
| 2/13/2016 | Summit League | Oral Roberts | 72 | W Illinois | 66 | 3128 | Mabee Center | 11300 | 27.68% |
| 2/10/2016 | Missouri Valley | Indiana State | 78 | S Illinois | 85 | 3221 | Hulman Center | 10200 | 31.58% |
| 2/11/2016 | Colonial Athletic | William & Mary | 80 | Hofstra | 86 | 3259 | Kaplan Arena | 8600 | 37.90% |
| 2/13/2016 | Horizon League | Detroit | 80 | Milwaukee | 66 | 3259 | Calihan Hall | 8295 | 39.29% |
| 2/11/2016 | Big Sky | Montana | 86 | Southern Utah | 53 | 3351 | Dahlberg Arena | 7321 | 45.77% |
| 2/13/2016 | MAC | Cent Michigan | 63 | Ball State | 75 | 3351 | McGuirk Arena | 5300 | 63.23% |
| 2/9/2016 | Sun Belt | Texas State | 53 | UT-Arlington | 65 | 3408 | Strahan Coliseum | 7200 | 47.33% |
| 2/13/2016 | MAC | N Illinois | 80 | Akron | 79 | 3457 | NIU Convocation Center | 10000 | 34.57% |
| 2/13/2016 | Ohio Valley | Murray State | 83 | SE Missouri St | 56 | 3569 | CFSB Center | 8602 | 41.49% |
| 2/10/2016 | Atlantic 10 | Davidson | 79 | La Salle | 66 | 3585 | John M. Belk Arena | 5223 | 68.64% |
| 2/11/2016 | Horizon League | Oakland | 85 | Milwaukee | 93 | 3589 | Athletics Center O’rena | 4005 | 89.61% |
| 2/13/2016 | Ohio Valley | Tenn Tech | 72 | Jacksonville St | 70 | 3611 | Hooper Eblen Center | 9282 | 38.90% |
| 2/10/2016 | The American | ECU | 92 | Tulane | 100 | 3656 | Minges Coliseum | 8000 | 45.70% |
| 2/8/2016 | Southern | Mercer | 66 | Chattanooga | 72 | 3721 | Hawkins Arena | 3500 | 106.31% |
| 2/8/2016 | Southland | SF Austin | 83 | Northwestern St | 72 | 3723 | William R. Johnson Coliseum | 7203 | 51.69% |
| 2/11/2016 | Sun Belt | UL Monroe | 86 | AR-Little Rock | 82 | 3761 | Fant-Ewing Coliseum | 7085 | 53.08% |
| 2/13/2016 | Sun Belt | UL Monroe | 78 | Arkansas State | 73 | 3792 | Fant-Ewing Coliseum | 7085 | 53.52% |
| 2/13/2016 | Ohio Valley | Morehead State | 78 | Belmont | 77 | 3845 | Ellis T. Johnson Arena | 6500 | 59.15% |
| 2/13/2016 | Horizon League | Oakland | 111 | Green Bay | 93 | 3908 | Athletics Center O’rena | 4005 | 97.58% |
| 2/9/2016 | Atlantic 10 | URI | 81 | George Mason | 63 | 3951 | Thomas M. Ryan Center | 7657 | 51.60% |
| 2/10/2016 | The American | Houston | 98 | Memphis | 90 | 4060 | Hofheinz Pavilion | 10000 | 40.60% |
| 2/14/2016 | America East | Stony Brook | 59 | UNH | 58 | 4109 | Island Federal Credit Union Arena | 4000 | 102.73% |
| 2/13/2016 | The American | Houston | 82 | UCF | 58 | 4126 | Hofheinz Pavilion | 10000 | 41.26% |
| 2/11/2016 | Colonial Athletic | UNC Wilmington | 86 | Elon | 82 | 4136 | Trask Coliseum | 6100 | 67.80% |
| 2/9/2016 | The American | UCF | 51 | Cincinnati | 69 | 4143 | CFE Arena | 9465 | 43.77% |
| 2/11/2016 | Missouri Valley | Evansville | 60 | Illinois State | 70 | 4195 | Ford Center | 19164 | 21.89% |
| 2/13/2016 | Atlantic 10 | Saint Joe’s | 88 | La Salle | 62 | 4200 | Hagan Arena | 4200 | 100.00% |
| 2/11/2016 | Ohio Valley | Morehead State | 61 | E Kentucky | 50 | 4214 | Ellis T. Johnson Arena | 6500 | 64.83% |
| 2/13/2016 | Big Sky | Montana | 85 | N Arizona | 67 | 4339 | Dahlberg Arena | 7321 | 59.27% |
| 2/13/2016 | Conference USA | W Kentucky | 93 | Marshall | 96 | 4373 | E. A. Diddle Arena | 7326 | 59.69% |
| 2/13/2016 | Missouri Valley | Missouri State | 89 | Indiana State | 85 | 4400 | JQH Arena | 11000 | 40.00% |
| 2/13/2016 | Big 12 | Oklahoma State | 58 | Kansas State | 55 | 4407 | Gallagher-Iba Arena | 13611 | 32.38% |
| 2/11/2016 | Sun Belt | LA-Lafayette | 83 | Arkansas State | 73 | 4420 | Cajundome | 13500 | 32.74% |
| 2/13/2016 | Conference USA | Charlotte | 103 | North Texas | 79 | 4444 | Halton Arena | 9105 | 48.81% |
| 2/11/2016 | Pac 12 | Stanford | 50 | Oregon State | 62 | 4519 | Maples Pavilion | 7329 | 61.66% |
| 2/9/2016 | Western Athletic | Grand Canyon | 95 | Benedictine (AZ) | 71 | 4632 | GCU Arena | 7000 | 66.17% |
| 2/11/2016 | West Coast | Portland | 66 | Gonzaga | 92 | 4852 | Chiles Center | 4852 | 100.00% |
| 2/8/2016 | America East | Binghamton | 56 | Albany | 69 | 4923 | Events Center (Binghamton) | 5142 | 95.74% |
| 2/8/2016 | Big 12 | TCU | 63 | Oklahoma State | 56 | 4957 | Ed and Rae Schollmaier Arena | 7201 | 68.84% |
| 2/13/2016 | Horizon League | Valparaiso | 59 | Wright State | 61 | 4987 | Athletics-Recreation Center | 5000 | 99.74% |
| 2/11/2016 | Conference USA | LA Tech | 73 | Mid Tennessee | 63 | 5011 | Thomas Assembly Center | 8098 | 61.88% |
| 2/13/2016 | MAC | Toledo | 93 | Miami (OH) | 49 | 5029 | Savage Arena | 9000 | 55.88% |
| 2/13/2016 | Summit League | South Dakota St | 85 | South Dakota | 68 | 5035 | Frost Arena | 6500 | 77.46% |
| 2/10/2016 | ACC | Georgia Tech | 71 | Wake Forest | 66 | 5089 | McCamish Pavilion | 9191 | 55.37% |
| 2/13/2016 | Colonial Athletic | UNC Wilmington | 78 | JMU | 68 | 5100 | Trask Coliseum | 6100 | 83.61% |
| 2/9/2016 | ACC | Boston College | 65 | UNC | 68 | 5126 | Silvio Conte Forum | 8606 | 59.56% |
| 2/10/2016 | Atlantic 10 | Saint Louis | 53 | Richmond | 67 | 5154 | Chaifetz Arena | 10600 | 48.62% |
| 2/13/2016 | Conference USA | LA Tech | 85 | UAB | 76 | 5213 | Thomas Assembly Center | 8098 | 64.37% |
| 2/13/2016 | Sun Belt | LA-Lafayette | 64 | AR-Little Rock | 68 | 5347 | Cajundome | 13500 | 39.61% |
| 2/8/2016 | Big East | Georgetown | 92 | St John’s | 67 | 5369 | Verizon Center | 18506 | 29.01% |
| 2/10/2016 | Missouri Valley | Bradley | 43 | Loyola (CHI) | 54 | 5400 | Carver Arena | 11164 | 48.37% |
| 2/13/2016 | Pac 12 | Stanford | 76 | Oregon | 72 | 5462 | Maples Pavilion | 7329 | 74.53% |
| 2/13/2016 | Missouri Valley | S Illinois | 75 | Drake | 60 | 5474 | SIU Arena | 8339 | 65.64% |
| 2/11/2016 | MAAC | Siena | 90 | Canisius | 67 | 5477 | Times Union Center | 15229 | 35.96% |
| 2/13/2016 | Atlantic 10 | St Bonaventure | 64 | G Washington | 57 | 5480 | Reilly Center | 5480 | 100.00% |
| 2/13/2016 | Southern | ETSU | 68 | Chattanooga | 76 | 5601 | Freedom Hall Civic Center | 5619 | 99.68% |
| 2/10/2016 | Mountain West | Nevada | 72 | Air Force | 52 | 5624 | Lawlor Events Center | 11536 | 48.75% |
| 2/13/2016 | Big Ten | Rutgers | 69 | OSU | 79 | 5658 | Louis Brown Athletic Center | 8000 | 70.73% |
| 2/10/2016 | Missouri Valley | Northern Iowa | 83 | Missouri State | 69 | 5755 | McLeod Center | 6650 | 86.54% |
| 2/12/2016 | Atlantic 10 | URI | 66 | Dayton | 68 | 6105 | Thomas M. Ryan Center | 7657 | 79.73% |
| 2/11/2016 | Conference USA | Old Dominion | 67 | North Texas | 47 | 6250 | Ted Constant Convocation Center | 9520 | 65.65% |
| 2/13/2016 | Southland | SF Austin | 70 | Texas A&M-CC | 58 | 6264 | William R. Johnson Coliseum | 7203 | 86.96% |
| 2/9/2016 | SEC | Miss St | 78 | Arkansas | 46 | 6272 | Humphrey Coliseum | 10575 | 59.31% |
| 2/13/2016 | Atlantic 10 | George Mason | 60 | Davidson | 59 | 6327 | EagleBank Arena | 10000 | 63.27% |
| 2/9/2016 | Big East | DePaul | 59 | Villanova | 86 | 6393 | Allstate Arena | 17500 | 36.53% |
| 2/10/2016 | Mountain West | Fresno State | 58 | San Diego State | 57 | 6476 | Save Mart Center | 15544 | 41.66% |
| 2/11/2016 | Big Sky | Weber State | 63 | Sacramento St | 50 | 6504 | Dee Events Center | 11500 | 56.56% |
| 2/9/2016 | ACC | Miami (FL) | 65 | Pitt | 63 | 6609 | BankUnited Center | 8000 | 82.61% |
| 2/14/2016 | Pac 12 | Arizona State | 65 | UCLA | 78 | 6710 | Wells Fargo Arena (AZ) | 10754 | 62.40% |
| 2/10/2016 | Big 12 | Texas Tech | 85 | Iowa State | 82 | 6715 | United Supermarkets Arena | 15020 | 44.71% |
| 2/13/2016 | Mountain West | Nevada | 77 | Fresno State | 72 | 6750 | Lawlor Events Center | 11536 | 58.51% |
| 2/13/2016 | Big Sky | Weber State | 87 | Portland State | 78 | 6798 | Dee Events Center | 11500 | 59.11% |
| 2/13/2016 | SEC | Miss St | 57 | Georgia | 66 | 6811 | Humphrey Coliseum | 10575 | 64.41% |
| 2/10/2016 | The American | SMU | 77 | Tulsa | 82 | 6852 | Moody Coliseum | 8998 | 76.15% |
| 2/13/2016 | Conference USA | Old Dominion | 66 | Rice | 75 | 7075 | Ted Constant Convocation Center | 9520 | 74.32% |
| 2/13/2016 | Atlantic 10 | Richmond | 71 | Fordham | 67 | 7201 | Robins Center | 9071 | 79.38% |
| 2/13/2016 | The American | SMU | 69 | Gonzaga | 60 | 7249 | Moody Coliseum | 8998 | 80.56% |
| 2/11/2016 | Pac 12 | Colorado | 88 | Washington St | 81 | 7330 | Coors Events Center | 11064 | 66.25% |
| 2/13/2016 | Mountain West | Boise State | 94 | Wyoming | 71 | 7334 | Taco Bell Arena | 12480 | 58.77% |
| 2/10/2016 | Big East | Seton Hall | 75 | Butler | 81 | 7476 | Prudential Center | 17625 | 42.42% |
| 2/13/2016 | Big 12 | Baylor | 66 | Texas Tech | 84 | 7540 | Ferrell Center | 10347 | 72.87% |
| 2/14/2016 | The American | Temple | 77 | USF | 65 | 7560 | Liacouras Center | 10206 | 74.07% |
| 2/13/2016 | Atlantic 10 | VCU | 85 | Saint Louis | 52 | 7637 | Stuart C. Siegel Center | 7617 | 100.26% |
| 2/12/2016 | Pac 12 | Arizona State | 74 | USC | 67 | 7772 | Wells Fargo Arena (AZ) | 10754 | 72.27% |
| 2/14/2016 | Missouri Valley | Illinois State | 75 | Bradley | 60 | 7888 | Redbird Arena | 10200 | 77.33% |
| 2/13/2016 | SEC | Auburn | 57 | Vanderbilt | 86 | 7954 | Auburn Arena | 9121 | 87.21% |
| 2/13/2016 | Big Ten | Northwestern | 58 | Illinois | 56 | 8117 | Welsh-Ryan Arena | 8117 | 100.00% |
| 2/8/2016 | ACC | Clemson | 83 | Notre Dame | 89 | 8195 | Bon Secours Wellness Arena | 14897 | 55.01% |
| 2/11/2016 | The American | Temple | 63 | UConn | 58 | 8316 | Liacouras Center | 10206 | 81.48% |
| 2/9/2016 | SEC | Florida | 77 | Ole Miss | 72 | 8345 | Stephen C. O’Connell Center | 12000 | 69.54% |
| 2/13/2016 | Big West | Hawaii | 76 | CS Fullerton | 59 | 8401 | Stan Sheriff Center | 10300 | 81.56% |
| 2/14/2016 | ACC | Boston College | 61 | Syracuse | 75 | 8606 | Silvio Conte Forum | 8606 | 100.00% |
| 2/13/2016 | ACC | Notre Dame | 71 | Louisville | 66 | 9149 | Purcell Pavilion | 9149 | 100.00% |
| 2/9/2016 | Mountain West | Utah State | 80 | New Mexico | 72 | 9290 | Dee Glen Smith Spectrum | 10270 | 90.46% |
| 2/8/2016 | ACC | Duke | 72 | Louisville | 65 | 9314 | Cameron Indoor Stadium | 9314 | 100.00% |
| 2/13/2016 | ACC | Duke | 63 | UVA | 62 | 9314 | Cameron Indoor Stadium | 9314 | 100.00% |
| 2/13/2016 | Pac 12 | Colorado | 81 | Washington | 80 | 9476 | Coors Events Center | 11064 | 85.65% |
| 2/14/2016 | ACC | FSU | 65 | Miami (FL) | 67 | 9492 | Donald L. Tucker Center | 12100 | 78.45% |
| 2/13/2016 | SEC | Ole Miss | 76 | Arkansas | 60 | 9500 | The Pavilion at Ole Miss | 9500 | 100.00% |
| 2/11/2016 | Big West | Hawaii | 74 | UC Irvine | 52 | 9826 | Stan Sheriff Center | 10300 | 95.40% |
| 2/10/2016 | SEC | Vanderbilt | 86 | Missouri | 71 | 10006 | Memorial Gymnasium (Vandy) | 15626 | 64.03% |
| 2/13/2016 | Big East | UConn | 75 | Tulsa | 73 | 10167 | Gampel Pavilion | 10167 | 100.00% |
| 2/13/2016 | Missouri Valley | Wichita State | 50 | Northern Iowa | 53 | 10506 | Charles Koch Arena | 10506 | 100.00% |
| 2/13/2016 | SEC | Missouri | 75 | Tennessee | 64 | 10536 | Mizzou Arena | 15061 | 69.96% |
| 2/11/2016 | Pac 12 | Cal | 83 | Oregon | 63 | 10628 | Haas Pavilion | 11877 | 89.48% |
| 2/13/2016 | Pac 12 | Cal | 83 | Oregon State | 71 | 10906 | Haas Pavilion | 11877 | 91.82% |
| 2/10/2016 | SEC | Alabama | 63 | Texas A&M | 62 | 11086 | Coleman Coliseum | 15383 | 72.07% |
| 2/10/2016 | Big Ten | Minnesota | 74 | Michigan | 82 | 11137 | Williams Arena | 14625 | 76.15% |
| 2/9/2016 | Big Ten | OSU | 71 | Northwestern | 63 | 11376 | Value City Arena | 18809 | 60.48% |
| 2/14/2016 | Pac 12 | Utah | 88 | Washington St | 47 | 11464 | Jon M. Huntsman Center | 15000 | 76.43% |
| 2/10/2016 | Big 12 | Kansas State | 72 | Baylor | 82 | 11636 | Bramlage Coliseum | 13762 | 84.55% |
| 2/10/2016 | Mountain West | UNLV | 64 | San Jose State | 61 | 11647 | Thomas & Mack Center | 18776 | 62.03% |
| 2/13/2016 | Mountain West | UNLV | 87 | Colorado State | 80 | 11753 | Thomas & Mack Center | 18776 | 62.60% |
| 2/13/2016 | SEC | Florida | 55 | Alabama | 61 | 12045 | Stephen C. O’Connell Center | 12000 | 100.38% |
| 2/13/2016 | ACC | Clemson | 66 | Georgia Tech | 52 | 12232 | Bon Secours Wellness Arena | 14897 | 82.11% |
| 2/13/2016 | Big 12 | Oklahoma | 72 | Kansas | 76 | 12247 | Lloyd Noble Center | 11528 | 106.24% |
| 2/13/2016 | Mountain West | San Diego State | 70 | Air Force | 61 | 12414 | Viejas Arena | 12414 | 100.00% |
| 2/13/2016 | Big East | Cincinnati | 75 | ECU | 60 | 12513 | Fifth Third Arena | 13176 | 94.97% |
| 2/13/2016 | Big East | Providence | 75 | Georgetown | 72 | 12582 | Dunkin Donuts Center | 12400 | 101.47% |
| 2/13/2016 | Big Ten | Michigan | 61 | Purdue | 56 | 12707 | Crisler Center | 13751 | 92.41% |
| 2/13/2016 | SEC | LSU | 76 | Texas A&M | 71 | 12928 | Pete Maravich Assembly Center | 14351 | 90.08% |
| 2/13/2016 | Big 12 | West Virginia | 73 | TCU | 42 | 13137 | WVU Coliseum | 14000 | 93.84% |
| 2/9/2016 | Atlantic 10 | Dayton | 76 | Duquesne | 74 | 13141 | University of Dayton Arena | 13435 | 97.81% |
| 2/13/2016 | Mountain West | New Mexico | 74 | San Jose State | 58 | 13411 | WisePies Arena | 15411 | 87.02% |
| 2/9/2016 | SEC | Tennessee | 71 | Auburn | 45 | 13740 | Thompson-Boling Arena | 21678 | 63.38% |
| 2/13/2016 | Big 12 | Iowa State | 85 | Texas | 75 | 14384 | Hilton Coliseum | 14356 | 100.20% |
| 2/9/2016 | ACC | UVA | 67 | Virginia Tech | 49 | 14395 | John Paul Jones Arena | 14593 | 98.64% |
| 2/10/2016 | Big East | Marquette | 96 | Providence | 91 | 14616 | BMO Harris Bradley Center | 17845 | 81.91% |
| 2/12/2016 | Pac 12 | Arizona | 81 | UCLA | 75 | 14644 | McKale Center | 14545 | 100.68% |
| 2/14/2016 | Pac 12 | Arizona | 86 | USC | 78 | 14644 | McKale Center | 14545 | 100.68% |
| 2/9/2016 | Big Ten | Purdue | 82 | Michigan State | 81 | 14846 | Mackey Arena | 14846 | 100.00% |
| 2/14/2016 | Big Ten | Iowa | 75 | Minnesota | 71 | 15400 | Carver-Hawkeye Arena | 15500 | 99.35% |
| 2/13/2016 | Big Ten | Nebraska | 70 | Penn State | 54 | 15613 | Pinnacle Bank Arena | 15147 | 103.08% |
| 2/13/2016 | Big East | Marquette | 62 | Creighton | 65 | 15844 | BMO Harris Bradley Center | 17845 | 88.79% |
| 2/10/2016 | SEC | South Carolina | 94 | LSU | 83 | 16009 | Colonial Life Arena | 18000 | 88.94% |
| 2/9/2016 | Big 12 | Kansas | 75 | West Virginia | 65 | 16300 | Allen Fieldhouse | 16300 | 100.00% |
| 2/9/2016 | Big East | Creighton | 70 | Xavier | 56 | 17011 | CenturyLink Center Omaha | 17100 | 99.48% |
| 2/13/2016 | ACC | NC State | 99 | Wake Forest | 88 | 17074 | PNC Arena | 18680 | 91.40% |
| 2/10/2016 | Big Ten | Wisconsin | 72 | Nebraska | 61 | 17287 | Kohl Center | 17230 | 100.33% |
| 2/11/2016 | Big Ten | Indiana | 85 | Iowa | 78 | 17472 | Assembly Hall (Indiana) | 17472 | 100.00% |
| 2/9/2016 | Big Ten | Maryland | 93 | BowieSt | 62 | 17950 | XFINITY Center | 17950 | 100.00% |
| 2/13/2016 | Big Ten | Maryland | 57 | Wisconsin | 70 | 17950 | XFINITY Center | 17950 | 100.00% |
| 2/13/2016 | SEC | South Carolina | 62 | Kentucky | 89 | 18000 | Colonial Life Arena | 18000 | 100.00% |
| 2/13/2016 | Big East | Villanova | 73 | St John’s | 63 | 18052 | Wells Fargo Center | 21600 | 83.57% |
| 2/14/2016 | ACC | UNC | 85 | Pitt | 64 | 20011 | Dean E. Smith Center | 21750 | 92.00% |
| 2/11/2016 | ACC | Syracuse | 85 | FSU | 72 | 22056 | Carrier Dome | 35446 | 62.22% |
| 2/9/2016 | SEC | Kentucky | 82 | Georgia | 48 | 22136 | Rupp Arena | 23500 | 94.20% |