Every fall, the college football season fires up and gives fans an opportunity to eschew responsibility in favor of sitting on the couch every Saturday for 15 weeks. Beautiful. With 825 games on the docket for the regular season, plus conference championships and bowls, all of our couch time comes at the expense of plenty of travel for all 128 FBS teams this season.
This season, I took a look at every team’s away and neutral site schedule and determined how much travel is necessary for each team. The list uses a handful of assumptions that I’ll hit on below, but the top team should be no surprise.
The Rainbow Warriors of Hawai’i will be the most traveled team in 2016, racking up 46,762 miles, all in the air of course, over the course of the season. That’s enough to circle the globe– twice. On the other side of the spectrum, Auburn likely won’t step foot in an airplane during their regular season, traveling a mere 1748 miles all season. Let’s take a look at the difference. First here’s Hawaii’s flight plans, including starting the season in Sydney, Australia against Cal:

And now, Auburn’s short trips through the Southeast:
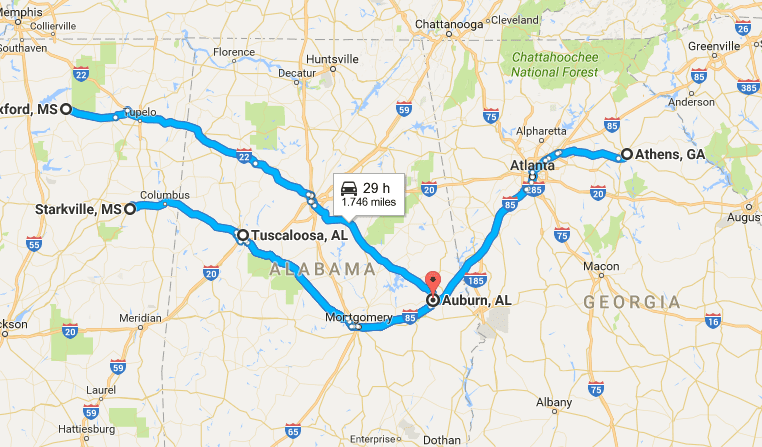
It’s clear to see the differences between the two, and the associated travel nightmare that the Rainbow Warriors tend to have to deal with annually. In fact, Hawaii will fly more than twice as far as the second most-traveled school in the FBS this season. That second team, surprisingly, is not Cal (who is third) with a trip to Sydney accounting for 15,000+ of their 20,000 miles this season. No, second place belongs to the mighty Minutemen of UMass, who will be playing in Gainesville, FL, Norfolk, VA, Columbia, SC, Troy, AL, Salt Lake City, UT, and Honolulu, HI, while playing all their “home” games across the state in Foxboro, a 92 mile trek. This sums up to 21,096 miles round trip. Before we continue on with more facts, let’s take a look at my assumptions.
Assumptions:
- “Power Five” conference teams will fly for anything longer than around 300 miles or five hours drive.
- Non-P5 teams will fly for anything longer than around 500 miles or eight hours drive.
- Driving mileage is via Google Maps’ quickest route.
- Flying mileage is via GCMap’s direct route between the most suitable airport nearest to campus to the nearest suitable airport for the opposing team.
- Teams return home after every week, which I’m pretty sure happens as even Hawaii has two weeks between away games this season.
With that, there may be a few cases where a team is likely to fly below the limit (e.g. Auburn budgets X plane trips a year and the plane is available), but I think this analysis should get you generally close to what reality will end up being. Taking a look at the conference breakdown, it’s no surprise that the Mountain West Conference takes the cake, with Hawaii dramatically raising the average distance. Below that is the Independents, who don’t receive the geographic benefits of being in a conference. Then the first Power Five conference with the Pac 12, the largest geographic spread of any major conference. At the bottom of the list, we find the SEC, with the average team traveling almost half as much as their Pac 12 counterparts. This is largely attributable to a compact footprint, even after the recent expansion added geographic outlier Texas A&M. Here’s the full conference average:
| Conference | Average distance |
|---|---|
| Mountain West | 13308 |
| Independent | 13118 |
| Pac 12 | 8471 |
| Sun Belt | 8369 |
| Conference USA | 7734 |
| The American | 7259 |
| ACC | 6188 |
| Big 12 | 5549 |
| Big East | 5534 |
| Big Ten | 4465 |
| MAC | 4291 |
| SEC | 4152 |
On the individual team level, beyond the previously mentioned top three and bottom, here are some other interesting notes.
- Notre Dame will do the most travel of a “Major” team (though not Power Five, I’m pretty sure most will consider them that, even as begrudgingly as I do as a Purdue fan) that does not leave North America (Cal goes to Sydney, Boston College to Dublin).
- Unsurprisingly, Rutgers and Maryland travel the most of Big Ten teams, more than 2200 miles farther than the longest-traveling “Original” Big Ten team (Minnesota)
- Eighteen teams will be flying to all their away games this year: Hawaii, Cal, Boise State, Notre Dame, FIU, Miami, Texas State, USF, UCLA, UTEP, Oregon State, USC, FSU, Missouri, Utah, Duke, Pitt, and LSU.
- Four teams will be driving to all their away games this year: Auburn, Western Michigan, Akron, and Miami of Ohio. That’s Auburn and 25% of the MAC.
- Arkansas State will spend the most time in the bus of any team this year, riding for 3,642 miles. MTSU is second with 3,518.
- Baylor will spend the most time in the bus of any Power Five team, with 2,228 miles on the roads to and from Waco. South Carolina is second with 2,738.
Okay, so enough random facts, here’s the whole list so you can see where your team falls:
| Travel rank | Team | Conference | Total distance | Flight distance | Driving distance |
|---|---|---|---|---|---|
| 1 | Hawaii | Mountain West | 46782 | 46782 | 0 |
| 2 | Massachusetts | Independent | 21096 | 20544 | 552 |
| 3 | California | Pac 12 | 20074 | 20074 | 0 |
| 4 | Nevada | Mountain West | 15082 | 13684 | 1398 |
| 5 | Boise State | Mountain West | 13850 | 13850 | 0 |
| 6 | New Mexico | Mountain West | 13490 | 13042 | 448 |
| 7 | New Mexico State | Sun Belt | 12780 | 12688 | 92 |
| 8 | Idaho | Sun Belt | 12596 | 11988 | 608 |
| 9 | Boston College | ACC | 12228 | 12168 | 60 |
| 10 | Notre Dame | Independent | 11904 | 11904 | 0 |
| 11 | UNLV | Mountain West | 11878 | 10674 | 1204 |
| 12 | San Diego State | Mountain West | 11556 | 10878 | 678 |
| 13 | Navy | Independent | 11128 | 10444 | 684 |
| 14 | BYU | Independent | 11122 | 10432 | 690 |
| 15 | Rice | Conference USA | 10892 | 9410 | 1482 |
| 16 | Georgia Tech | ACC | 10378 | 10234 | 144 |
| 17 | Florida Intl | Conference USA | 10376 | 10376 | 0 |
| 18 | Fresno State | Mountain West | 10342 | 9742 | 600 |
| 19 | Army | Independent | 10340 | 8948 | 1392 |
| 20 | Tulsa | The American | 10102 | 8310 | 1792 |
| 21 | San Jose State | Mountain West | 9928 | 8702 | 1226 |
| 22 | Miami FL | ACC | 9660 | 9660 | 0 |
| 23 | Tulane | The American | 9446 | 8750 | 696 |
| 24 | Georgia State | Sun Belt | 9264 | 7624 | 1640 |
| 25 | Air Force | Mountain West | 9260 | 8862 | 398 |
| 26 | Rutgers | Big Ten | 9152 | 8750 | 402 |
| 27 | Colorado | Pac 12 | 8982 | 8924 | 58 |
| 28 | Texas State | Sun Belt | 8806 | 8806 | 0 |
| 29 | South Florida | The American | 8786 | 8786 | 0 |
| 30 | West Virginia | Big 12 | 8768 | 8340 | 428 |
| 31 | UCLA | Pac 12 | 8584 | 8584 | 0 |
| 32 | Stanford | Pac 12 | 8450 | 7634 | 816 |
| 33 | Buffalo | MAC | 8372 | 5260 | 3112 |
| 34 | Ga Southern | Sun Belt | 8296 | 5460 | 2836 |
| 35 | UTEP | Conference USA | 8290 | 8290 | 0 |
| 36 | North Texas | Conference USA | 8172 | 7006 | 1166 |
| 37 | Louisiana Tech | Conference USA | 8156 | 6384 | 1772 |
| 38 | Arizona State | Pac 12 | 7926 | 7722 | 204 |
| 39 | FL Atlantic | Conference USA | 7880 | 7712 | 168 |
| 40 | Old Dominion | Conference USA | 7866 | 6146 | 1720 |
| 41 | Oregon State | Pac 12 | 7836 | 7836 | 0 |
| 42 | Maryland | Big Ten | 7774 | 7376 | 398 |
| 43 | UT San Antonio | Conference USA | 7700 | 6948 | 752 |
| 44 | Kansas State | Big 12 | 7622 | 7006 | 616 |
| 45 | Virginia | ACC | 7450 | 6394 | 1056 |
| 46 | UCF | The American | 7438 | 6798 | 640 |
| 47 | Troy | Sun Belt | 7372 | 5314 | 2058 |
| 48 | Texas | Big 12 | 7328 | 6938 | 390 |
| 49 | Oregon | Pac 12 | 7286 | 6278 | 1008 |
| 50 | Arkansas State | Sun Belt | 7230 | 3588 | 3642 |
| 51 | Appalachian State | Sun Belt | 7206 | 4364 | 2842 |
| 52 | Southern Miss | Conference USA | 7180 | 6848 | 332 |
| 53 | Connecticut | The American | 7088 | 6918 | 170 |
| 54 | USC | Pac 12 | 7048 | 7048 | 0 |
| 55 | Charlotte | Conference USA | 7036 | 5456 | 1580 |
| 56 | Wyoming | Mountain West | 7010 | 5894 | 1116 |
| 57 | Florida State | ACC | 6976 | 6976 | 0 |
| 58 | South Alabama | Sun Belt | 6666 | 3794 | 2872 |
| 59 | Missouri | SEC | 6664 | 6664 | 0 |
| 60 | Mississippi State | SEC | 6632 | 6272 | 360 |
| 61 | Arizona | Pac 12 | 6582 | 6348 | 234 |
| 62 | SMU | The American | 6516 | 5730 | 786 |
| 63 | Temple | The American | 6516 | 5662 | 854 |
| 64 | Utah | Pac 12 | 6496 | 6496 | 0 |
| 65 | N Illinois | MAC | 6386 | 3796 | 2590 |
| 66 | MTSU | Conference USA | 6368 | 2850 | 3518 |
| 67 | Washington | Pac 12 | 6322 | 5186 | 1136 |
| 68 | ULM | Sun Belt | 6290 | 2904 | 3386 |
| 69 | Louisville | ACC | 6246 | 5850 | 396 |
| 70 | East Carolina | The American | 6216 | 4224 | 1992 |
| 71 | Marshall | Conference USA | 6078 | 5520 | 558 |
| 72 | Houston | The American | 6064 | 5256 | 808 |
| 73 | Washington State | Pac 12 | 6060 | 5472 | 588 |
| 74 | Duke | ACC | 5940 | 5940 | 0 |
| 75 | Colorado State | Mountain West | 5928 | 5532 | 396 |
| 76 | Pittsburgh | ACC | 5828 | 5828 | 0 |
| 77 | Minnesota | Big Ten | 5578 | 5042 | 536 |
| 78 | Texas A&M | SEC | 5576 | 5200 | 376 |
| 79 | ULL | Sun Belt | 5548 | 4146 | 1402 |
| 80 | Cincinnati | Big East | 5534 | 5172 | 362 |
| 81 | Texas Tech | Big 12 | 5446 | 4790 | 656 |
| 82 | Kansas | Big 12 | 5350 | 4516 | 834 |
| 83 | LSU | SEC | 5236 | 5236 | 0 |
| 84 | Toledo | MAC | 5216 | 4048 | 1168 |
| 85 | Oklahoma | Big 12 | 5128 | 4378 | 750 |
| 86 | Ball State | MAC | 5090 | 2904 | 2186 |
| 87 | Baylor | Big 12 | 5050 | 2228 | 2822 |
| 88 | Indiana | Big Ten | 5044 | 4096 | 948 |
| 89 | Nebraska | Big Ten | 4902 | 4298 | 604 |
| 90 | North Carolina | ACC | 4854 | 4446 | 408 |
| 91 | Iowa | Big Ten | 4816 | 3720 | 1096 |
| 92 | Iowa State | Big 12 | 4728 | 3934 | 794 |
| 93 | Utah State | Mountain West | 4584 | 2160 | 2424 |
| 94 | C Michigan | MAC | 4572 | 2674 | 1898 |
| 95 | WKU | Conference USA | 4554 | 2574 | 1980 |
| 96 | Syracuse | ACC | 4522 | 3476 | 1046 |
| 97 | Memphis | The American | 4416 | 1584 | 2832 |
| 98 | Florida | SEC | 4400 | 3564 | 836 |
| 99 | Ohio State | Big Ten | 4234 | 3710 | 524 |
| 100 | Ohio | MAC | 4030 | 1408 | 2622 |
| 101 | Arkansas | SEC | 3932 | 2960 | 972 |
| 102 | Mississippi | SEC | 3862 | 3348 | 514 |
| 103 | Georgia | SEC | 3768 | 3298 | 470 |
| 104 | Illinois | Big Ten | 3722 | 2902 | 820 |
| 105 | TCU | Big 12 | 3662 | 3042 | 620 |
| 106 | South Carolina | SEC | 3636 | 898 | 2738 |
| 107 | Clemson | ACC | 3562 | 2436 | 1126 |
| 108 | Kent State | MAC | 3430 | 1294 | 2136 |
| 109 | Purdue | Big Ten | 3420 | 3004 | 416 |
| 110 | Alabama | SEC | 3400 | 3086 | 314 |
| 111 | E Michigan | MAC | 3354 | 2038 | 1316 |
| 112 | Virginia Tech | ACC | 3304 | 2242 | 1062 |
| 113 | Kentucky | SEC | 3296 | 2796 | 500 |
| 114 | Michigan State | Big Ten | 3268 | 1676 | 1592 |
| 115 | Penn State | Big Ten | 3268 | 2536 | 732 |
| 116 | Tennessee | SEC | 3192 | 1610 | 1582 |
| 117 | Wake Forest | ACC | 2974 | 2608 | 366 |
| 118 | Miami OH | MAC | 2898 | 0 | 2898 |
| 119 | Akron | MAC | 2820 | 0 | 2820 |
| 120 | Vanderbilt | SEC | 2782 | 1726 | 1056 |
| 121 | NC State | ACC | 2708 | 1894 | 814 |
| 122 | Bowling Green | MAC | 2706 | 1106 | 1600 |
| 123 | W Michigan | MAC | 2612 | 0 | 2612 |
| 124 | Wisconsin | Big Ten | 2540 | 1086 | 1454 |
| 125 | Northwestern | Big Ten | 2488 | 1258 | 1230 |
| 126 | Oklahoma State | Big 12 | 2404 | 632 | 1772 |
| 127 | Michigan | Big Ten | 2308 | 1794 | 514 |
| 128 | Auburn | SEC | 1748 | 0 | 1748 |