Numbers are down big this week, likely due to a major snowstorm that enveloped the east coast. That being said, this week has a first. A team making the list twice in the bottom 3 in attendance! This is almost as good as the US sweeping the podium at the Olympics. Almost.
First off, a sum of all the games with low attendance this week:
Number of games drawing fewer than 1,000 fans: 33
The top 3?
3. Bryant vs St. Francis (PA) – This game took place on Thursday night in Smithfield, RI, before the snow was coming down. Even still, the threat of the big snowstorm limited the crowd to a mere 365, with the rest presumably raiding their supermarket’s bread and milk aisles. Here’s an action shot:

Unlike most low attendance numbers, this 365 looks fairly realistic, as you can see quite a few people in the crowd. Those 365 were still sent home disappointed, however, after St. Francis (of Pennsylvania) took the game 71-65.
2. Drexel vs UNC-Wilmington – Meanwhile in Philly, this game was originally scheduled to be played on Saturday, but was postponed due to weather. After the postponement, 332 people still managed to dig themselves out to see this one. The Dragons, who sit near the bottom of the Colonial Athletic Association’s standings, have nothing impressive to offer their fans this year, being only 3-16 (1-7 in the CAA), and Sunday was no different as the Seahawks of UNC-Wilmington scored 77 to Drexel’s 71.
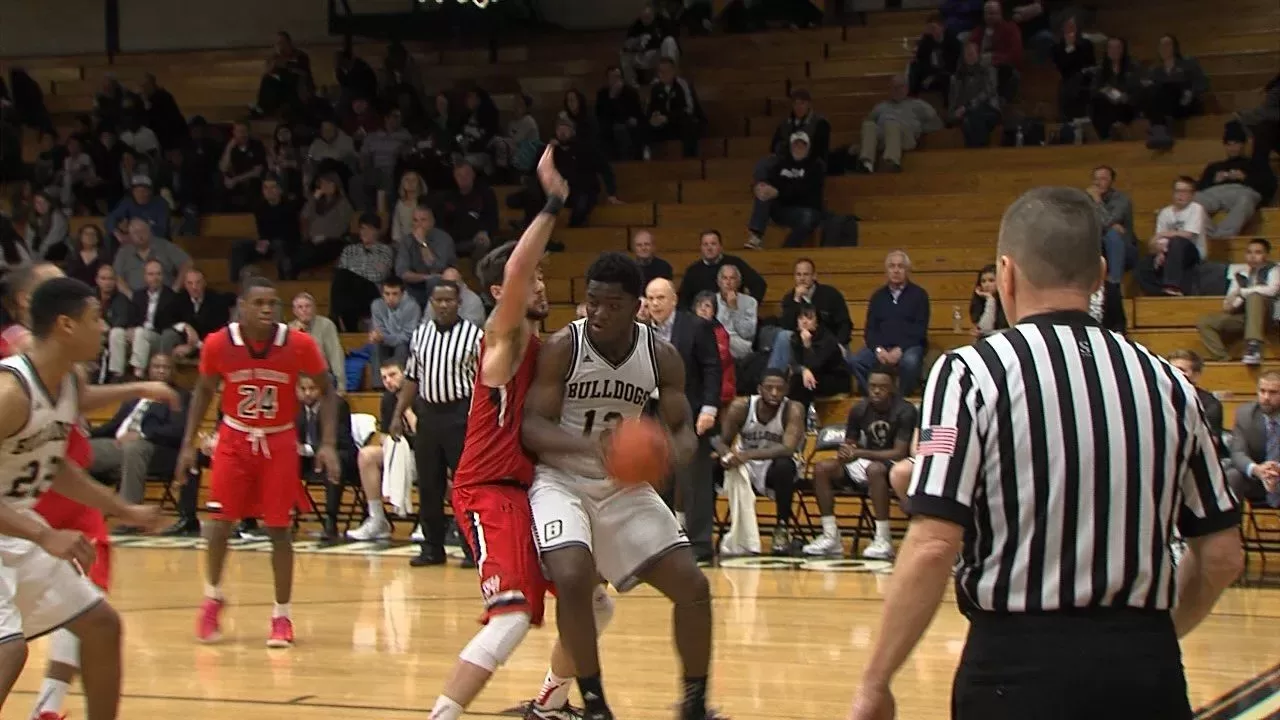
1. Bryant vs Robert Morris – And finally, our big winner and second appearance in the top 3 this week, as 323 came out during the snowstorm to see the middling Bryant Bulldogs take on the Robert Morris Colonials. In what is turning out to be a tight NEC this year, this game could’ve put Bryant in the catbird seat for the conference title, but the Bulldogs fell short of Robert Morris by a score of 65-54. The good news for Bryant? They’re playing the worst team in Division 1 next week: Central Connecticut State.
Here’s the miscellany for the week:
Biggest group of people to see a loss at home this week: NC State (vs Duke) 19,500.
Smallest group of people to see a win at home this week: Fairleigh-Dickinson (vs LIU-Brooklyn), 379.
Smallest Power Conference attendance: Boston College (vs Miami (FL)), 3,286.
Smalled Power Conference attendance at a home win: Washington (vs Colorado), 6,325.
Average attendance this week: 4,729 (down 1,165 (19.8%) over last week)
And as always, your full attendance numbers for the week:
| Date | Conference | Home Team | Home Score | Away Team | Away Score | Attendance | Venue | Capacity | % full |
|---|---|---|---|---|---|---|---|---|---|
| 1/23/2016 | Northeast | Bryant | 54 | Robert Morris | 65 | 323 | Chace Athletic Center | 2700 | 11.96% |
| 1/24/2016 | Colonial Athletic | Drexel | 71 | UNC Wilmington | 77 | 332 | Daskalakis Athletic Center | 2532 | 13.11% |
| 1/21/2016 | Northeast | Bryant | 65 | St Francis (PA) | 71 | 365 | Chace Athletic Center | 2700 | 13.52% |
| 1/21/2016 | Northeast | Fair Dickinson | 101 | LIU Brooklyn | 95 | 379 | Rothman Center | 5000 | 7.58% |
| 1/21/2016 | Northeast | St Francis (BKN) | 59 | Wagner | 83 | 405 | Pope Physical Education Center | 2000 | 20.25% |
| 1/23/2016 | Northeast | LIU Brooklyn | 49 | St Francis (BKN) | 64 | 417 | Wellness | 2500 | 16.68% |
| 1/18/2016 | SWAC | Grambling St | 54 | Texas Southern | 69 | 537 | Fredrick C. Hobdy Assembly Center | 7500 | 7.16% |
| 1/18/2016 | Patriot League | Boston U | 87 | Loyola (MD) | 84 | 590 | Case Gym | 1800 | 32.78% |
| 1/18/2016 | MEAC | S Carolina St | 68 | MD-E Shore | 63 | 613 | S-H-M Memorial Center | 3200 | 19.16% |
| 1/19/2016 | Ohio Valley | SE Missouri St | 84 | Hannibal-LaGrange Co | 61 | 625 | Show Me Center | 6972 | 8.96% |
| 1/18/2016 | Southland | SE Louisiana | 98 | Lamar | 70 | 641 | University Center (LA) | 7500 | 8.55% |
| 1/24/2016 | Patriot League | Colgate | 76 | Holy Cross | 61 | 674 | Cotterell Court | 3000 | 22.47% |
| 1/20/2016 | Big South | Presbyterian | 72 | Charleston So | 73 | 690 | Ross E. Templeton P.E. Center | 2300 | 30.00% |
| 1/21/2016 | America East | UMBC | 87 | Hartford | 98 | 697 | Retriever Activities Center | 4024 | 17.32% |
| 1/23/2016 | SWAC | PV A&M | 44 | AR-Pine Bluff | 45 | 718 | William Nicks Building | 6500 | 11.05% |
| 1/24/2016 | Northeast | Wagner | 58 | Sacred Heart | 67 | 731 | Spiro Sports Center | 2100 | 34.81% |
| 1/21/2016 | Atlantic Sun | NJIT | 83 | Jacksonville | 63 | 755 | Fleisher Center | 1500 | 50.33% |
| 1/23/2016 | Patriot League | Boston U | 71 | Bucknell | 74 | 791 | Case Gym | 1800 | 43.94% |
| 1/20/2016 | Patriot League | Colgate | 85 | Boston U | 78 | 795 | Cotterell Court | 3000 | 26.50% |
| 1/20/2016 | Patriot League | Loyola (MD) | 58 | Bucknell | 67 | 796 | Reitz Arena | 3000 | 26.53% |
| 1/23/2016 | Northeast | Cent Conn St | 64 | St Francis (PA) | 79 | 812 | William H. Detrick Gymnasium | 2654 | 30.60% |
| 1/18/2016 | MEAC | Bethune-Cookman | 62 | Morgan State | 50 | 863 | Moore Gymnasium | 3000 | 28.77% |
| 1/21/2016 | Big West | CS Northridge | 76 | Cal Poly | 74 | 867 | Matadome | 3106 | 27.91% |
| 1/19/2016 | Southern | Wofford | 89 | TENN Wesleyan | 66 | 880 | Benjamin Johnson Arena | 3500 | 25.14% |
| 1/23/2016 | Big West | CS Fullerton | 75 | Cal Poly | 83 | 892 | Titan Gym | 5015 | 17.79% |
| 1/23/2016 | MEAC | MD-E Shore | 74 | Bethune-Cookman | 72 | 932 | Hytche Arena | 5500 | 16.95% |
| 1/23/2016 | Big West | UC Riverside | 74 | LBSU | 72 | 935 | SRC Arena | 3168 | 29.51% |
| 1/21/2016 | Western Athletic | UMKC | 79 | Utah Valley | 90 | 957 | Municipal Auditorium (MO) | 7300 | 13.11% |
| 1/23/2016 | Western Athletic | Chicago State | 76 | Utah Valley | 82 | 957 | Jones Convocation Center | 7000 | 13.67% |
| 1/21/2016 | Summit League | IPFW | 79 | North Dakota St | 74 | 964 | Allen County War Memorial Coliseum | 13000 | 7.42% |
| 1/21/2016 | Conference USA | UTSA | 56 | FIU | 72 | 966 | UTSA Convocation Center | 4080 | 23.68% |
| 1/23/2016 | Big South | Charleston So | 63 | Coast Carolina | 78 | 972 | CSU Field House | 881 | 110.33% |
| 1/20/2016 | Patriot League | Lehigh | 64 | Navy | 69 | 979 | Stabler Arena | 6000 | 16.32% |
| 1/24/2016 | Big South | Radford | 69 | Gardner-Webb | 59 | 1011 | Donald N. Dedmon Center | 3205 | 31.54% |
| 1/21/2016 | Northeast | Cent Conn St | 45 | Robert Morris | 59 | 1017 | William H. Detrick Gymnasium | 2654 | 38.32% |
| 1/18/2016 | MEAC | Savannah State | 64 | Delaware State | 47 | 1020 | Tiger Arena | 6000 | 17.00% |
| 1/24/2016 | MAAC | Rider | 75 | Quinnipiac | 52 | 1024 | Alumni Gymnasium (Rider) | 1650 | 62.06% |
| 1/21/2016 | West Coast | Pepperdine | 76 | San Diego | 58 | 1030 | Firestone Fieldhouse | 4500 | 22.89% |
| 1/19/2016 | Western Athletic | Chicago State | 66 | Green Bay | 99 | 1032 | Jones Convocation Center | 7000 | 14.74% |
| 1/24/2016 | Big East | St John’s | 73 | Marquette | 78 | 1032 | Carnesecca Arena | 5602 | 18.42% |
| 1/23/2016 | Big South | UNC Asheville | 67 | Presbyterian | 55 | 1034 | Kimmel Arena | 3200 | 32.31% |
| 1/23/2016 | Ohio Valley | E Kentucky | 83 | Tenn Tech | 89 | 1050 | McBrayer Arena | 6500 | 16.15% |
| 1/23/2016 | Big Sky | Sacramento St | 63 | Portland State | 81 | 1058 | The Nest | 900 | 117.56% |
| 1/23/2016 | MAC | E Michigan | 87 | Ball State | 88 | 1067 | Convocation Center (MI) | 8824 | 12.09% |
| 1/24/2016 | Ivy League | Princeton | 100 | Bryn Athyn | 44 | 1072 | Jadwin Gymnasium | 6854 | 15.64% |
| 1/21/2016 | Summit League | Denver | 55 | Omaha | 69 | 1078 | Magness Arena | 7200 | 14.97% |
| 1/24/2016 | Southern | W Carolina | 86 | Mercer | 80 | 1112 | Ramsey Center | 7826 | 14.21% |
| 1/23/2016 | Conference USA | UTSA | 71 | FAU | 86 | 1128 | UTSA Convocation Center | 4080 | 27.65% |
| 1/18/2016 | Horizon League | Cleveland State | 70 | UIC | 53 | 1129 | Wolstein Center | 13610 | 8.30% |
| 1/20/2016 | Big South | Gardner-Webb | 58 | Winthrop | 71 | 1174 | Paul Porter Arena | 5000 | 23.48% |
| 1/23/2016 | Colonial Athletic | Northeastern | 72 | Towson | 79 | 1187 | Matthews Arena | 6000 | 19.78% |
| 1/21/2016 | Southern | VMI | 83 | Samford | 76 | 1189 | Cameron Hall | 5020 | 23.69% |
| 1/18/2016 | MEAC | NC A&T | 68 | Norfolk State | 75 | 1206 | Corbett Sports Center | 5700 | 21.16% |
| 1/19/2016 | MAC | Miami (OH) | 60 | Buffalo | 77 | 1221 | Millett Hall | 6400 | 19.08% |
| 1/24/2016 | Big South | Longwood | 68 | Winthrop | 82 | 1224 | Willett Hall | 2522 | 48.53% |
| 1/23/2016 | Southland | McNeese State | 75 | Northwestern St | 74 | 1231 | Burton Coliseum | 6500 | 18.94% |
| 1/23/2016 | Colonial Athletic | Elon | 64 | JMU | 82 | 1248 | Alumni Gym (Elon University) | 1585 | 78.74% |
| 1/22/2016 | MAAC | Iona | 64 | St Peter’s | 58 | 1250 | Hynes Athletics Center | 2611 | 47.87% |
| 1/20/2016 | Big South | Radford | 78 | Campbell | 66 | 1254 | Donald N. Dedmon Center | 3205 | 39.13% |
| 1/18/2016 | Southland | Sam Houston | 87 | Nicholls State | 76 | 1260 | Bernard G. Johnson Coliseum | 6110 | 20.62% |
| 1/24/2016 | America East | UMass Lowell | 57 | Binghamton | 64 | 1276 | Tsongas Center | 6496 | 19.64% |
| 1/24/2016 | MAAC | Fairfield | 98 | Iona | 91 | 1278 | Webster Bank Arena | 10000 | 12.78% |
| 1/23/2016 | Summit League | W Illinois | 52 | North Dakota St | 65 | 1301 | Western Hall | 5139 | 25.32% |
| 1/22/2016 | Ivy League | Brown | 66 | Yale | 90 | 1302 | Pizzitola Sports Center | 2800 | 46.50% |
| 1/23/2016 | Big Sky | Southern Utah | 72 | North Dakota | 88 | 1337 | Centrum Arena | 5300 | 25.23% |
| 1/22/2016 | MAAC | Marist | 76 | Fairfield | 88 | 1338 | McCann Arena | 3200 | 41.81% |
| 1/18/2016 | America East | Hartford | 43 | Stony Brook | 77 | 1352 | Chase Arena | 4107 | 32.92% |
| 1/21/2016 | Big Sky | Southern Utah | 80 | N Colorado | 90 | 1356 | Centrum Arena | 5300 | 25.58% |
| 1/20/2016 | Patriot League | Holy Cross | 69 | Army | 65 | 1359 | Hart Center | 3600 | 37.75% |
| 1/21/2016 | Colonial Athletic | Northeastern | 92 | Hofstra | 96 | 1359 | Matthews Arena | 6000 | 22.65% |
| 1/21/2016 | Ohio Valley | Austin Peay | 90 | SIU ED | 86 | 1365 | Dave Aaron Arena | 9000 | 15.17% |
| 1/21/2016 | Western Athletic | Seattle | 60 | New Mexico St | 68 | 1365 | KeyArena | 17072 | 8.00% |
| 1/21/2016 | West Coast | Santa Clara | 61 | San Francisco | 74 | 1413 | Leavey Center | 5000 | 28.26% |
| 1/21/2016 | Sun Belt | Appalachian St | 76 | Georgia State | 67 | 1450 | Holmes Convocation Center | 8325 | 17.42% |
| 1/23/2016 | SWAC | Alcorn State | 63 | Alabama A&M | 58 | 1459 | Davey Whitney Complex | 7000 | 20.84% |
| 1/23/2016 | MEAC | Norfolk State | 87 | S Carolina St | 74 | 1461 | Echols Hall | 7000 | 20.87% |
| 1/21/2016 | Colonial Athletic | Towson | 37 | Charleston | 40 | 1466 | SECU Arena | 5250 | 27.92% |
| 1/19/2016 | MAC | N Illinois | 75 | Cent Michigan | 70 | 1497 | NIU Convocation Center | 10000 | 14.97% |
| 1/23/2016 | SWAC | Jackson State | 60 | Grambling St | 45 | 1499 | Lee E. Williams Athletic and Assembly Center | 8000 | 18.74% |
| 1/21/2016 | Western Athletic | CSU Bakersfield | 77 | UT Rio Grande | 58 | 1501 | Icardo Center | 3800 | 39.50% |
| 1/21/2016 | Northeast | Sacred Heart | 76 | Mt St Mary’s | 71 | 1502 | William H. Pitt Center | 2062 | 72.84% |
| 1/20/2016 | Patriot League | Lafayette | 73 | American U | 81 | 1507 | Kirby Sports Center | 4000 | 37.68% |
| 1/18/2016 | SWAC | Jackson State | 60 | PV A&M | 57 | 1523 | Lee E. Williams Athletic and Assembly Center | 8000 | 19.04% |
| 1/23/2016 | Big Sky | N Arizona | 79 | N Colorado | 84 | 1529 | J. Lawrence Walkup Skydome | 16230 | 9.42% |
| 1/23/2016 | Summit League | IPFW | 82 | IUPUI | 84 | 1530 | Allen County War Memorial Coliseum | 13000 | 11.77% |
| 1/23/2016 | Ivy League | Dartmouth | 63 | Harvard | 50 | 1531 | Edward Leede Arena | 2100 | 72.90% |
| 1/23/2016 | Sun Belt | UL Monroe | 100 | South Alabama | 68 | 1556 | Fant-Ewing Coliseum | 7085 | 21.96% |
| 1/23/2016 | Southland | Nicholls State | 83 | Cent Arkansas | 94 | 1567 | Stopher Gymnasium | 3800 | 41.24% |
| 1/21/2016 | America East | UMass Lowell | 76 | UNH | 78 | 1580 | Costello Athletic Center | 2100 | 75.24% |
| 1/24/2016 | MAAC | Canisius | 78 | Siena | 99 | 1614 | Koessler Athletic Center | 2176 | 74.17% |
| 1/19/2016 | Southland | Northwestern St | 79 | Texas A&M-CC | 89 | 1620 | Prather Coliseum | 3900 | 41.54% |
| 1/20/2016 | Big South | High Point | 73 | UNC Asheville | 69 | 1629 | Millis Athletic Center | 1750 | 93.09% |
| 1/23/2016 | Mountain West | San Jose State | 64 | New Mexico | 83 | 1633 | Event Center (San Jose St.) | 5000 | 32.66% |
| 1/21/2016 | Southern | W Carolina | 91 | The Citadel | 92 | 1638 | Ramsey Center | 7826 | 20.93% |
| 1/20/2016 | Summit League | South Dakota | 76 | W Illinois | 67 | 1674 | The DakotaDome | 10000 | 16.74% |
| 1/20/2016 | Atlantic 10 | Fordham | 73 | George Mason | 62 | 1689 | Rose Hill Gymnasium | 3470 | 48.67% |
| 1/23/2016 | Big West | UCSB | 74 | CS Northridge | 61 | 1693 | The Thunderdome | 6512 | 26.00% |
| 1/18/2016 | Horizon League | Youngstown St | 65 | Valparaiso | 96 | 1703 | Beeghly Center | 6500 | 26.20% |
| 1/21/2016 | Southern | UNC Greensboro | 60 | Chattanooga | 73 | 1718 | Greensboro Coliseum | 21273 | 8.08% |
| 1/23/2016 | Southland | Incarnate Word | 74 | Abil Christian | 60 | 1722 | McDermott Convocation Center | 2000 | 86.10% |
| 1/23/2016 | Western Athletic | Seattle | 70 | UT Rio Grande | 59 | 1752 | KeyArena | 17072 | 10.26% |
| 1/22/2016 | Horizon League | N Kentucky | 82 | UIC | 69 | 1755 | The Bank of Kentucky Center | 9400 | 18.67% |
| 1/24/2016 | Southern | UNC Greensboro | 86 | Samford | 78 | 1755 | Greensboro Coliseum | 21273 | 8.25% |
| 1/18/2016 | America East | Maine | 91 | UNH | 99 | 1783 | Cross Insurance Center | 5800 | 30.74% |
| 1/21/2016 | Western Athletic | Chicago State | 65 | Grand Canyon | 90 | 1783 | Jones Convocation Center | 7000 | 25.47% |
| 1/21/2016 | Atlantic Sun | Kennesaw St | 74 | FGCU | 79 | 1809 | KSU Convocation Center | 4792 | 37.75% |
| 1/19/2016 | Big South | Liberty | 55 | Longwood | 53 | 1828 | Vines Center | 8085 | 22.61% |
| 1/23/2016 | SWAC | Southern | 73 | Alabama State | 69 | 1891 | F. G. Clark Activity Center | 7500 | 25.21% |
| 1/21/2016 | MAAC | Manhattan | 78 | Monmouth | 71 | 1898 | Draddy Gymnasium | 2345 | 80.94% |
| 1/23/2016 | Atlantic Sun | Kennesaw St | 79 | Stetson | 84 | 1909 | KSU Convocation Center | 4792 | 39.84% |
| 1/24/2016 | America East | Vermont | 79 | UMBC | 72 | 1925 | Patrick Gymnasium | 3228 | 59.63% |
| 1/18/2016 | America East | Vermont | 82 | UMass Lowell | 93 | 1939 | Patrick Gymnasium | 3228 | 60.07% |
| 1/20/2016 | Big West | UCSB | 67 | LBSU | 77 | 1975 | The Thunderdome | 6512 | 30.33% |
| 1/24/2016 | Atlantic 10 | Fordham | 50 | Dayton | 64 | 2014 | Rose Hill Gymnasium | 3470 | 58.04% |
| 1/20/2016 | Mountain West | Air Force | 79 | Colorado State | 83 | 2021 | Clune Arena | 5858 | 34.50% |
| 1/23/2016 | Mountain West | Air Force | 55 | Fresno State | 56 | 2083 | Clune Arena | 5858 | 35.56% |
| 1/22/2016 | MAAC | Niagara | 61 | Canisius | 70 | 2110 | Gallagher Center | 2400 | 87.92% |
| 1/19/2016 | MAAC | Fairfield | 71 | St Peter’s | 77 | 2113 | Webster Bank Arena | 10000 | 21.13% |
| 1/18/2016 | Sun Belt | Arkansas State | 76 | AR-Little Rock | 73 | 2136 | ASU Convocation Center | 10475 | 20.39% |
| 1/23/2016 | Western Athletic | UMKC | 78 | Grand Canyon | 85 | 2186 | Municipal Auditorium (MO) | 7300 | 29.95% |
| 1/20/2016 | Big West | UC Irvine | 72 | CS Fullerton | 59 | 2211 | Bren Events Center | 4984 | 44.36% |
| 1/23/2016 | Big Sky | Idaho State | 69 | Weber State | 68 | 2236 | Holt Arena | 8000 | 27.95% |
| 1/21/2016 | Big West | UC Davis | 58 | UC Riverside | 55 | 2247 | The Pavilion (UC Davis) | 7926 | 28.35% |
| 1/23/2016 | Southern | Furman | 63 | Wofford | 62 | 2252 | Timmons Arena | 4000 | 56.30% |
| 1/23/2016 | Southland | Lamar | 79 | Houston Baptist | 92 | 2312 | Montagne Center | 10080 | 22.94% |
| 1/21/2016 | America East | Binghamton | 52 | Vermont | 61 | 2314 | Events Center (Binghamton) | 5142 | 45.00% |
| 1/21/2016 | Ohio Valley | Murray State | 68 | E Illinois | 58 | 2328 | CFSB Center | 8602 | 27.06% |
| 1/21/2016 | Big Sky | Montana State | 85 | E Washington | 71 | 2362 | Brick Breeden Fieldhouse | 7250 | 32.58% |
| 1/18/2016 | America East | Albany | 80 | Binghamton | 59 | 2418 | SEFCU Arena | 4538 | 53.28% |
| 1/23/2016 | Big Sky | Montana State | 70 | Idaho | 68 | 2435 | Brick Breeden Fieldhouse | 7250 | 33.59% |
| 1/23/2016 | Ohio Valley | Austin Peay | 86 | E Illinois | 87 | 2467 | Dave Aaron Arena | 9000 | 27.41% |
| 1/23/2016 | SWAC | Texas Southern | 75 | Miss Valley St | 60 | 2468 | H&PE Arena | 8100 | 30.47% |
| 1/21/2016 | West Coast | Pacific | 70 | Portland | 61 | 2502 | Alex G. Spanos Center | 6150 | 40.68% |
| 1/23/2016 | Big South | Liberty | 69 | High Point | 67 | 2526 | Vines Center | 8085 | 31.24% |
| 1/19/2016 | Horizon League | Oakland | 73 | N Kentucky | 90 | 2533 | Athletics Center O’rena | 4005 | 63.25% |
| 1/20/2016 | Missouri Valley | Drake | 70 | Missouri State | 79 | 2561 | The Knapp Center | 7152 | 35.81% |
| 1/22/2016 | Atlantic 10 | George Mason | 75 | Duquesne | 86 | 2626 | EagleBank Arena | 10000 | 26.26% |
| 1/24/2016 | Horizon League | Cleveland State | 55 | Youngstown St | 70 | 2633 | Quicken Loans Arena | 20562 | 12.81% |
| 1/21/2016 | West Coast | Loyola Mary | 80 | BYU | 91 | 2681 | Gersten Pavilion | 4156 | 64.51% |
| 1/18/2016 | SWAC | AR-Pine Bluff | 65 | Alcorn State | 73 | 2689 | H. O. Clemmons Arena | 4500 | 59.76% |
| 1/21/2016 | Ohio Valley | E Kentucky | 91 | Jacksonville St | 88 | 2700 | McBrayer Arena | 6500 | 41.54% |
| 1/21/2016 | Pac 12 | Washington St | 71 | Utah | 92 | 2717 | Friel Court | 12058 | 22.53% |
| 1/24/2016 | MAAC | Monmouth | 83 | Marist | 72 | 2785 | Multipurpose Activity Center | 4100 | 67.93% |
| 1/18/2016 | MEAC | Florida A&M | 66 | Coppin State | 70 | 2789 | Al Lawson Center | 8470 | 32.93% |
| 1/23/2016 | Southern | ETSU | 101 | The Citadel | 92 | 2789 | Freedom Hall Civic Center | 5619 | 49.64% |
| 1/21/2016 | Colonial Athletic | JMU | 68 | Drexel | 45 | 2807 | JMU Convocation Center | 7156 | 39.23% |
| 1/19/2016 | MAC | Akron | 92 | E Michigan | 88 | 2839 | James A. Rhodes Arena | 5500 | 51.62% |
| 1/23/2016 | Sun Belt | Texas State | 78 | Arkansas State | 68 | 2857 | Strahan Coliseum | 7200 | 39.68% |
| 1/22/2016 | Atlantic 10 | G Washington | 62 | URI | 58 | 2913 | Charles E. Smith Center | 4338 | 67.15% |
| 1/23/2016 | Colonial Athletic | Charleston | 59 | Delaware | 58 | 2913 | TD Arena | 5100 | 57.12% |
| 1/23/2016 | Missouri Valley | Loyola (CHI) | 68 | Drake | 63 | 2925 | Joseph J. Gentile Center | 4486 | 65.20% |
| 1/21/2016 | Southern | ETSU | 65 | Mercer | 63 | 3003 | Freedom Hall Civic Center | 5619 | 53.44% |
| 1/23/2016 | Ohio Valley | Murray State | 70 | SIU ED | 54 | 3011 | CFSB Center | 8602 | 35.00% |
| 1/23/2016 | West Coast | Pepperdine | 71 | BYU | 65 | 3019 | Firestone Fieldhouse | 4500 | 67.09% |
| 1/24/2016 | Atlantic 10 | La Salle | 48 | Saint Joe’s | 69 | 3021 | Tom Gola Arena | 4000 | 75.53% |
| 1/18/2016 | MEAC | NC Central | 79 | Hampton | 80 | 3065 | McDougald-McLendon Gymnasium | 3056 | 100.29% |
| 1/23/2016 | MAC | W Michigan | 91 | Buffalo | 71 | 3079 | University Arena (MI) | 5421 | 56.80% |
| 1/23/2016 | MAC | Bowling Green | 59 | Kent State | 62 | 3100 | Stroh Center | 4700 | 65.96% |
| 1/23/2016 | Horizon League | Milwaukee | 83 | Detroit | 80 | 3107 | UW-Milwaukee Panther Arena | 12700 | 24.46% |
| 1/21/2016 | Sun Belt | UT-Arlington | 91 | Arkansas State | 64 | 3111 | College Park Center | 7000 | 44.44% |
| 1/23/2016 | West Coast | Loyola Mary | 67 | San Diego | 63 | 3120 | Gersten Pavilion | 4156 | 75.07% |
| 1/22/2016 | MAC | N Illinois | 58 | Toledo | 49 | 3166 | NIU Convocation Center | 10000 | 31.66% |
| 1/19/2016 | MAC | Ball State | 68 | Kent State | 76 | 3190 | John E. Worthen Arena | 11500 | 27.74% |
| 1/21/2016 | Colonial Athletic | William & Mary | 89 | Elon | 67 | 3278 | Kaplan Arena | 8600 | 38.12% |
| 1/21/2016 | Sun Belt | UL Monroe | 85 | Troy | 74 | 3284 | Fant-Ewing Coliseum | 7085 | 46.35% |
| 1/20/2016 | ACC | Boston College | 53 | Miami (FL) | 67 | 3286 | Silvio Conte Forum | 8606 | 38.18% |
| 1/19/2016 | MAC | Bowling Green | 74 | Toledo | 81 | 3304 | Stroh Center | 4700 | 70.30% |
| 1/23/2016 | Pac 12 | Washington St | 70 | Colorado | 75 | 3321 | Friel Court | 12058 | 27.54% |
| 1/23/2016 | MAC | Cent Michigan | 72 | Ohio | 49 | 3333 | McGuirk Arena | 5300 | 62.89% |
| 1/23/2016 | Conference USA | Southern Miss | 59 | LA Tech | 70 | 3334 | Reed Green Coliseum | 8095 | 41.19% |
| 1/23/2016 | West Coast | Saint Mary’s | 89 | Portland | 74 | 3338 | McKeon Pavilion | 3500 | 95.37% |
| 1/21/2016 | Sun Belt | Texas State | 74 | AR-Little Rock | 77 | 3357 | Strahan Coliseum | 7200 | 46.63% |
| 1/21/2016 | Summit League | Oral Roberts | 74 | South Dakota St | 86 | 3361 | Mabee Center | 11300 | 29.74% |
| 1/23/2016 | Atlantic 10 | UMass | 75 | Saint Louis | 86 | 3484 | William D. Mullins Memorial Center | 9493 | 36.70% |
| 1/20/2016 | Big East | USF | 54 | UCF | 64 | 3491 | USF Sun Dome | 10411 | 33.53% |
| 1/23/2016 | MEAC | Hampton | 75 | Savannah State | 52 | 3521 | Convocation Center (VA) | 7200 | 48.90% |
| 1/21/2016 | Ohio Valley | UT Martin | 72 | Belmont | 82 | 3598 | Skyhawk Arena | 5000 | 71.96% |
| 1/23/2016 | MAC | Akron | 75 | Miami (OH) | 46 | 3686 | James A. Rhodes Arena | 5500 | 67.02% |
| 1/23/2016 | The American | Houston | 62 | USF | 71 | 3724 | Hofheinz Pavilion | 10000 | 37.24% |
| 1/18/2016 | Horizon League | Wright State | 77 | Detroit | 76 | 3733 | Nutter Center | 10400 | 35.89% |
| 1/21/2016 | Big Sky | Montana | 58 | Idaho | 63 | 3733 | Dahlberg Arena | 7321 | 50.99% |
| 1/21/2016 | Conference USA | Mid Tennessee | 86 | North Texas | 64 | 3826 | Murphy Athletic Center | 11807 | 32.40% |
| 1/19/2016 | Colonial Athletic | Georgia State | 69 | Ga Southern | 66 | 3854 | GSU Sports Arena | 4500 | 85.64% |
| 1/19/2016 | The American | ECU | 69 | Tulsa | 84 | 3878 | Minges Coliseum | 8000 | 48.48% |
| 1/23/2016 | Western Athletic | CSU Bakersfield | 67 | New Mexico St | 68 | 3880 | Icardo Center | 3800 | 102.11% |
| 1/18/2016 | MAAC | Monmouth | 85 | Siena | 69 | 3911 | Multipurpose Activity Center | 4100 | 95.39% |
| 1/23/2016 | Horizon League | Green Bay | 95 | Oakland | 111 | 3928 | Resch Center | 10200 | 38.51% |
| 1/23/2016 | Ivy League | Cornell | 68 | Columbia | 79 | 3935 | Newman Arena | 4473 | 87.97% |
| 1/19/2016 | Missouri Valley | Evansville | 74 | Loyola (CHI) | 66 | 4014 | Ford Center | 19164 | 20.95% |
| 1/21/2016 | Conference USA | Charlotte | 103 | Marshall | 95 | 4015 | Halton Arena | 9105 | 44.10% |
| 1/21/2016 | #N/A | UNC Wilmington | 79 | Delaware | 70 | 4037 | Trask Coliseum | 6100 | 66.18% |
| 1/21/2016 | Sun Belt | LA-Lafayette | 92 | South Alabama | 82 | 4050 | Cajundome | 13500 | 30.00% |
| 1/22/2016 | America East | Stony Brook | 69 | Albany | 63 | 4109 | Island Federal Credit Union Arena | 4000 | 102.73% |
| 1/19/2016 | Atlantic 10 | St Bonaventure | 79 | Dayton | 85 | 4176 | Reilly Center | 5480 | 76.20% |
| 1/23/2016 | Conference USA | Charlotte | 88 | W Kentucky | 71 | 4197 | Halton Arena | 9105 | 46.10% |
| 1/21/2016 | Big Ten | Rutgers | 76 | Iowa | 90 | 4209 | Louis Brown Athletic Center | 8000 | 52.61% |
| 1/24/2016 | The American | Tulsa | 75 | UCF | 60 | 4270 | Reynolds Center | 8355 | 51.11% |
| 1/23/2016 | West Coast | Pacific | 61 | Gonzaga | 71 | 4309 | Alex G. Spanos Center | 6150 | 70.07% |
| 1/24/2016 | Horizon League | Wright State | 80 | UIC | 66 | 4437 | Nutter Center | 10400 | 42.66% |
| 1/24/2016 | Missouri Valley | Indiana State | 82 | Evansville | 65 | 4630 | Hulman Center | 10200 | 45.39% |
| 1/23/2016 | Summit League | South Dakota | 75 | South Dakota St | 79 | 4832 | The DakotaDome | 10000 | 48.32% |
| 1/24/2016 | Missouri Valley | Missouri State | 65 | S Illinois | 80 | 4835 | JQH Arena | 11000 | 43.95% |
| 1/23/2016 | Big Sky | Montana | 74 | E Washington | 69 | 4923 | Dahlberg Arena | 7321 | 67.24% |
| 1/20/2016 | Mountain West | Wyoming | 69 | Nevada | 75 | 4959 | Arena-Auditorium | 15028 | 33.00% |
| 1/23/2016 | Sun Belt | UT-Arlington | 62 | AR-Little Rock | 68 | 5033 | College Park Center | 7000 | 71.90% |
| 1/20/2016 | Missouri Valley | S Illinois | 79 | Indiana State | 66 | 5036 | SIU Arena | 8339 | 60.39% |
| 1/18/2016 | Big Ten | Rutgers | 57 | Purdue | 107 | 5085 | Louis Brown Athletic Center | 8000 | 63.56% |
| 1/20/2016 | Atlantic 10 | Saint Louis | 96 | Davidson | 87 | 5103 | Chaifetz Arena | 10600 | 48.14% |
| 1/21/2016 | Pac 12 | Stanford | 57 | Arizona | 71 | 5275 | Maples Pavilion | 7329 | 71.97% |
| 1/23/2016 | Summit League | Oral Roberts | 79 | Omaha | 85 | 5308 | Mabee Center | 11300 | 46.97% |
| 1/20/2016 | Missouri Valley | Northern Iowa | 55 | Wichita State | 74 | 5425 | McLeod Center | 6650 | 81.58% |
| 1/21/2016 | MAAC | Siena | 63 | Rider | 52 | 5449 | Times Union Center | 15229 | 35.78% |
| 1/20/2016 | SEC | Missouri | 57 | Georgia | 60 | 5453 | Mizzou Arena | 15061 | 36.21% |
| 1/22/2016 | Horizon League | Wright State | 73 | Valparaiso | 62 | 5499 | Nutter Center | 10400 | 52.88% |
| 1/21/2016 | Conference USA | UAB | 82 | Rice | 70 | 5535 | Bartow Arena | 8508 | 65.06% |
| 1/18/2016 | Big 12 | TCU | 69 | Texas Tech | 76 | 5905 | Ed and Rae Schollmaier Arena | 7201 | 82.00% |
| 1/20/2016 | Mountain West | Boise State | 94 | San Jose State | 69 | 5992 | Taco Bell Arena | 12480 | 48.01% |
| 1/23/2016 | Big 12 | TCU | 60 | Iowa State | 73 | 6014 | Ed and Rae Schollmaier Arena | 7201 | 83.52% |
| 1/21/2016 | Conference USA | UTEP | 71 | FAU | 56 | 6054 | Don Haskins Center | 12222 | 49.53% |
| 1/23/2016 | Sun Belt | LA-Lafayette | 88 | Troy | 65 | 6064 | Cajundome | 13500 | 44.92% |
| 1/23/2016 | Mountain West | Wyoming | 71 | Boise State | 81 | 6091 | Arena-Auditorium | 15028 | 40.53% |
| 1/24/2016 | The American | Temple | 89 | SMU | 80 | 6096 | Liacouras Center | 10206 | 59.73% |
| 1/20/2016 | Pac 12 | Washington | 95 | Colorado | 83 | 6325 | Alaska Airlines Arena | 12961 | 48.80% |
| 1/19/2016 | MAC | Ohio | 82 | W Michigan | 64 | 6346 | Convocation Center | 10563 | 60.08% |
| 1/21/2016 | Conference USA | Old Dominion | 68 | W Kentucky | 62 | 6535 | Ted Constant Convocation Center | 9520 | 68.64% |
| 1/23/2016 | Conference USA | UAB | 78 | North Texas | 57 | 6835 | Bartow Arena | 8508 | 80.34% |
| 1/23/2016 | ACC | Miami (FL) | 77 | Wake Forest | 63 | 6928 | BankUnited Center | 8000 | 86.60% |
| 1/24/2016 | Pac 12 | Oregon State | 85 | USC | 70 | 7020 | Gill Coliseum | 9604 | 73.09% |
| 1/19/2016 | The American | SMU | 77 | Houston | 73 | 7059 | Moody Coliseum | 8998 | 78.45% |
| 1/23/2016 | Missouri Valley | Illinois State | 76 | Northern Iowa | 67 | 7103 | Redbird Arena | 10200 | 69.64% |
| 1/23/2016 | Southland | SF Austin | 76 | Sam Houston | 64 | 7123 | William R. Johnson Coliseum | 7203 | 98.89% |
| 1/23/2016 | Conference USA | Old Dominion | 75 | Marshall | 78 | 7140 | Ted Constant Convocation Center | 9520 | 75.00% |
| 1/21/2016 | Big Ten | Penn State | 60 | Wisconsin | 66 | 7145 | Bryce Jordan Center | 15261 | 46.82% |
| 1/24/2016 | Big East | Villanova | 76 | Providence | 82 | 7191 | Wells Fargo Center | 21600 | 33.29% |
| 1/20/2016 | Missouri Valley | Bradley | 52 | Illinois State | 55 | 7300 | Carver Arena | 11164 | 65.39% |
| 1/19/2016 | SEC | Ole Miss | 74 | South Carolina | 77 | 7427 | The Pavilion at Ole Miss | 9500 | 78.18% |
| 1/20/2016 | Atlantic 10 | VCU | 93 | Duquesne | 71 | 7637 | Stuart C. Siegel Center | 7617 | 100.26% |
| 1/24/2016 | Atlantic 10 | VCU | 84 | St Bonaventure | 76 | 7637 | Stuart C. Siegel Center | 7617 | 100.26% |
| 1/23/2016 | Conference USA | UTEP | 69 | FIU | 79 | 7688 | Don Haskins Center | 12222 | 62.90% |
| 1/23/2016 | ACC | Georgia Tech | 71 | Louisville | 75 | 7829 | McCamish Pavilion | 9191 | 85.18% |
| 1/20/2016 | ACC | Notre Dame | 83 | Virginia Tech | 81 | 7888 | Purcell Pavilion | 9149 | 86.22% |
| 1/20/2016 | Ivy League | Penn | 60 | Saint Joe’s | 75 | 8030 | Palestra | 8722 | 92.07% |
| 1/24/2016 | Pac 12 | Washington | 75 | Utah | 80 | 8073 | Alaska Airlines Arena | 12961 | 62.29% |
| 1/19/2016 | SEC | Florida | 81 | Miss St | 78 | 8250 | Stephen C. O’Connell Center | 12000 | 68.75% |
| 1/21/2016 | Pac 12 | Oregon | 89 | USC | 81 | 8471 | Matthew Knight Arena | 12369 | 68.49% |
| 1/20/2016 | Big East | Seton Hall | 71 | Villanova | 72 | 8788 | Prudential Center | 17625 | 49.86% |
| 1/23/2016 | SEC | Miss St | 83 | Ole Miss | 77 | 8932 | Humphrey Coliseum | 10575 | 84.46% |
| 1/21/2016 | Pac 12 | Cal | 75 | Arizona State | 70 | 9096 | Haas Pavilion | 11877 | 76.58% |
| 1/19/2016 | SEC | Auburn | 83 | Alabama | 77 | 9121 | Auburn Arena | 9121 | 100.00% |
| 1/23/2016 | ACC | Notre Dame | 76 | Boston College | 49 | 9149 | Purcell Pavilion | 9149 | 100.00% |
| 1/23/2016 | ACC | FSU | 72 | Pitt | 74 | 9160 | Donald L. Tucker Center | 12100 | 75.70% |
| 1/23/2016 | Big West | Hawaii | 78 | UC Davis | 62 | 9289 | Stan Sheriff Center | 10300 | 90.18% |
| 1/18/2016 | ACC | Duke | 62 | Syracuse | 64 | 9314 | Cameron Indoor Stadium | 12000 | 77.62% |
| 1/19/2016 | Big East | UConn | 60 | Tulane | 42 | 9516 | XL Center | 16294 | 58.40% |
| 1/24/2016 | ACC | Virginia Tech | 70 | UNC | 75 | 9567 | Cassell Coliseum | 9847 | 97.16% |
| 1/19/2016 | ACC | Pitt | 61 | NC State | 78 | 9849 | Petersen Events Center | 12508 | 78.74% |
| 1/20/2016 | Big 12 | West Virginia | 49 | Texas | 56 | 9881 | WVU Coliseum | 14000 | 70.58% |
| 1/19/2016 | Big East | Xavier | 72 | Georgetown | 81 | 9906 | Cintas Center | 10250 | 96.64% |
| 1/23/2016 | Big 12 | Baylor | 72 | Oklahoma | 82 | 10206 | Ferrell Center | 10347 | 98.64% |
| 1/21/2016 | Big East | Cincinnati | 76 | Memphis | 72 | 10320 | Fifth Third Arena | 13176 | 78.32% |
| 1/23/2016 | Big East | Xavier | 84 | Seton Hall | 76 | 10368 | Cintas Center | 10250 | 101.15% |
| 1/23/2016 | Missouri Valley | Wichita State | 88 | Bradley | 54 | 10506 | Charles Koch Arena | 10506 | 100.00% |
| 1/23/2016 | SEC | Georgia | 76 | Arkansas | 73 | 10523 | Stegeman Coliseum | 11200 | 93.96% |
| 1/23/2016 | Pac 12 | Oregon | 86 | UCLA | 72 | 10525 | Matthew Knight Arena | 12369 | 85.09% |
| 1/23/2016 | Big 12 | Texas Tech | 76 | West Virginia | 80 | 10732 | United Supermarkets Arena | 15020 | 71.45% |
| 1/19/2016 | Big East | Providence | 71 | Butler | 68 | 10918 | Dunkin Donuts Center | 12400 | 88.05% |
| 1/23/2016 | Big Ten | Minnesota | 71 | Illinois | 76 | 11026 | Williams Arena | 14625 | 75.39% |
| 1/24/2016 | The American | Memphis | 83 | ECU | 84 | 11165 | FedExForum | 18119 | 61.62% |
| 1/23/2016 | SEC | Florida | 95 | Auburn | 63 | 11230 | Stephen C. O’Connell Center | 12000 | 93.58% |
| 1/23/2016 | Mountain West | Nevada | 65 | UNLV | 63 | 11341 | Lawlor Events Center | 11536 | 98.31% |
| 1/19/2016 | Big 12 | Oklahoma State | 86 | Kansas | 67 | 11383 | Gallagher-Iba Arena | 13611 | 83.63% |
| 1/20/2016 | Big Ten | Michigan | 74 | Minnesota | 69 | 11726 | Crisler Center | 13751 | 85.27% |
| 1/23/2016 | Pac 12 | Cal | 74 | Arizona | 73 | 11858 | Haas Pavilion | 11877 | 99.84% |
| 1/23/2016 | SEC | Texas A&M | 66 | Missouri | 53 | 12198 | Reed Arena | 12989 | 93.91% |
| 1/23/2016 | Big 12 | Kansas State | 89 | Oklahoma State | 73 | 12298 | Bramlage Coliseum | 13762 | 89.36% |
| 1/19/2016 | Mountain West | San Diego State | 73 | Fresno State | 67 | 12414 | Viejas Arena | 12414 | 100.00% |
| 1/23/2016 | Mountain West | San Diego State | 70 | Utah State | 55 | 12414 | Viejas Arena | 12414 | 100.00% |
| 1/20/2016 | Big East | Marquette | 56 | DePaul | 57 | 12695 | BMO Harris Bradley Center | 17845 | 71.14% |
| 1/24/2016 | ACC | UVA | 73 | Syracuse | 65 | 13305 | John Paul Jones Arena | 14593 | 91.17% |
| 1/20/2016 | SEC | Tennessee | 74 | Vanderbilt | 88 | 13561 | Thompson-Boling Arena | 21678 | 62.56% |
| 1/19/2016 | SEC | Texas A&M | 71 | LSU | 57 | 13888 | Reed Arena | 12989 | 106.92% |
| 1/23/2016 | SEC | Tennessee | 78 | South Carolina | 69 | 13928 | Thompson-Boling Arena | 21678 | 64.25% |
| 1/18/2016 | Big 12 | Iowa State | 82 | Oklahoma | 77 | 14384 | Hilton Coliseum | 14356 | 100.20% |
| 1/19/2016 | ACC | UVA | 69 | Clemson | 62 | 14398 | John Paul Jones Arena | 14593 | 98.66% |
| 1/20/2016 | Big Ten | Michigan State | 71 | Nebraska | 72 | 14797 | Breslin Center | 16280 | 90.89% |
| 1/23/2016 | Big Ten | Michigan State | 74 | Maryland | 65 | 14797 | Breslin Center | 16280 | 90.89% |
| 1/21/2016 | Big Ten | Purdue | 75 | OSU | 64 | 14846 | Mackey Arena | 14846 | 100.00% |
| 1/23/2016 | SEC | Alabama | 70 | LSU | 72 | 15383 | Coleman Coliseum | 15383 | 100.00% |
| 1/24/2016 | Big Ten | Iowa | 83 | Purdue | 71 | 15400 | Carver-Hawkeye Arena | 15500 | 99.35% |
| 1/23/2016 | Big East | UConn | 68 | Georgetown | 62 | 15564 | XL Center | 16294 | 95.52% |
| 1/23/2016 | Big Ten | Nebraska | 68 | Michigan | 81 | 15745 | Pinnacle Bank Arena | 15147 | 103.95% |
| 1/23/2016 | Big 12 | Kansas | 76 | Texas | 67 | 16300 | Allen Fieldhouse | 17288 | 94.29% |
| 1/19/2016 | Big Ten | Maryland | 62 | Northwestern | 56 | 17144 | XFINITY Center | 17950 | 95.51% |
| 1/19/2016 | Big Ten | Indiana | 103 | Illinois | 69 | 17472 | Assembly Hall (Indiana) | 17472 | 100.00% |
| 1/23/2016 | Big Ten | Indiana | 89 | Northwestern | 57 | 17472 | Assembly Hall (Indiana) | 17472 | 100.00% |
| 1/23/2016 | Big East | Creighton | 72 | Butler | 64 | 17677 | CenturyLink Center Omaha | 17100 | 103.37% |
| 1/21/2016 | SEC | Arkansas | 66 | Kentucky | 80 | 18588 | Bud Walton Arena | 20320 | 91.48% |
| 1/20/2016 | ACC | UNC | 83 | Wake Forest | 68 | 19053 | Dean E. Smith Center | 21750 | 87.60% |
| 1/23/2016 | ACC | NC State | 78 | Duke | 88 | 19500 | PNC Arena | 18680 | 104.39% |
| 1/20/2016 | ACC | Louisville | 84 | FSU | 65 | 21349 | KFC Yum! Center | 22000 | 97.04% |
| 1/23/2016 | SEC | Kentucky | 76 | Vanderbilt | 57 | 22975 | Rupp Arena | 23500 | 97.77% |