It’s finals week in most places, which means significantly fewer basketball games than usual. Only 134 with reported attendance figures, our lowest week of the year. Even with that, some surprising numbers on the attendance front! Without further ado, let’s take a look:
Number of games drawing fewer than 1,000 fans: 26 (Season total: 275)
Here are the 3 lowest attended games of last week:
- Sacramento State vs Westcliff – A buy game that probably wasn’t the buy, as Sacramento State only drew 307 fans. In some regards it may have been worth it, as the Hornets took home the 89-40 victory. Here’s a blurry shot from the highlights:

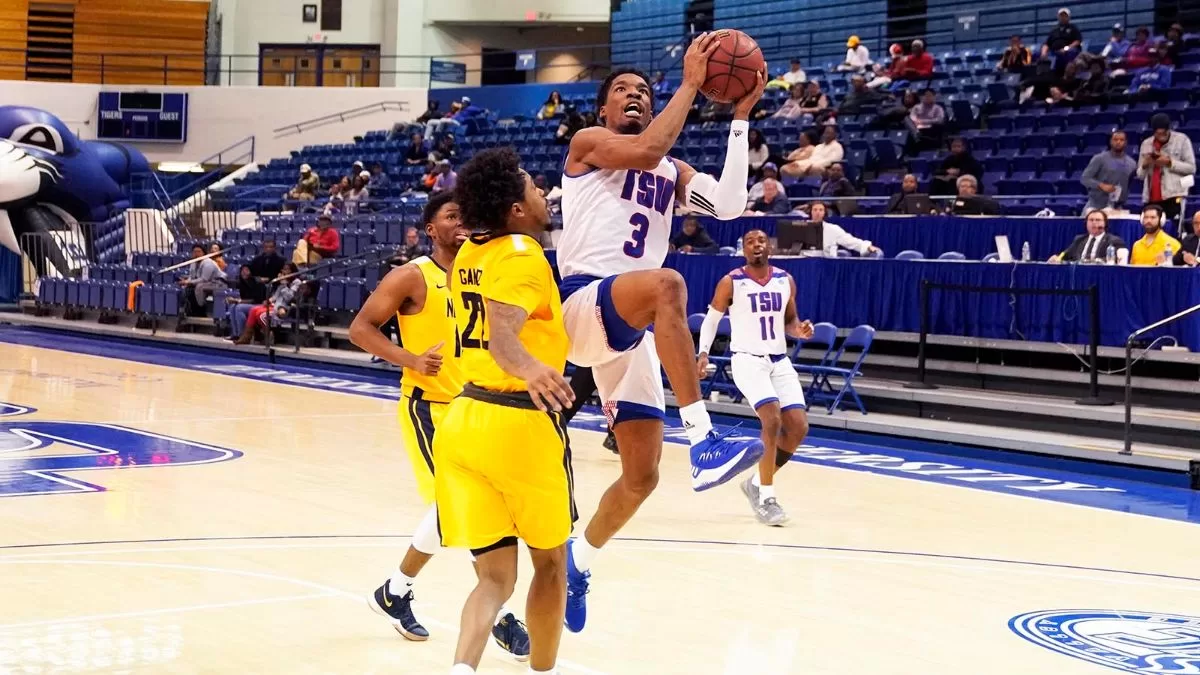
- Tennessee State vs NC A&T – Our lowest game of the week featuring two D-I schools, Tennessee State had only 303 show up for their game against the Aggiest of North Carolina A&T. Even worse, the home crowd was sent home disappointed with a 78-76 NC A&T win over the Tigers. An action shot:

- Presbyterian vs Trinity Baptist – The Blue Hose make frequent appearances here in the bottom three, and this is their first shot of the year, hosting Trinity Baptist. With only 251 in the Ross E. Templeton P.E. Center, you have to wonder if the 87-44 victory was worth it when you figure out how uch they had to pay the NCCAA (no typo there) level team
So now, what happened to everyone else? Let’s go ahead with the miscellany:
Biggest group of people to see a loss at home this week: Syracuse (vs Old Dominion) 17,585.
Smallest group of people to see a win at home this week: Presbyterian (vs Trinity Baptist) 251
Smallest Power 5 Conference attendance: Boston College (vs Columbia), 3,295.
Average attendance this week: 4,622 (down 106 [2.2%] from last week)
And as always, your full attendance numbers for the week:
| Date | Conference | Home Team | Home Score | Away Team | Away Score | Attendance | Venue | Capacity | % Full |
|---|---|---|---|---|---|---|---|---|---|
| 12/15/2018 | Big South | Presbyterian | 87 | Trinity Baptist | 44 | 251 | Ross E. Templeton P.E. Center | 2300 | 10.9% |
| 12/15/2018 | Ohio Valley | Tennessee State | 76 | North Carolina A&T | 78 | 303 | Gentry Center | 10500 | 2.9% |
| 12/13/2018 | Big Sky | Sacramento State | 89 | Westcliff | 40 | 307 | The Nest | 900 | 34.1% |
| 12/12/2018 | Big South | Presbyterian | 103 | Virginia Military | 70 | 373 | Ross E. Templeton P.E. Center | 2300 | 16.2% |
| 12/12/2018 | Northeast | Bryant | 74 | Hartford | 91 | 418 | Chace Athletic Center | 2700 | 15.5% |
| 12/13/2018 | Big South | Longwood | 81 | Averett | 57 | 432 | Willett Hall | 2522 | 17.1% |
| 12/15/2018 | Patriot League | Colgate | 82 | Marist | 66 | 433 | Cotterell Court | 3000 | 14.4% |
| 12/15/2018 | Northeast | St. Francis (NY) | 56 | Saint Peter’s | 53 | 448 | Pope Physical Education Center | 2000 | 22.4% |
| 12/15/2018 | Big Sky | Idaho | 80 | Nebraska-Omaha | 89 | 459 | Cowan Spectrum | 7000 | 6.6% |
| 12/11/2018 | Northeast | St. Francis (NY) | 75 | UMass-Lowell | 69 | 518 | Pope Physical Education Center | 2000 | 25.9% |
| 12/12/2018 | Northeast | Fairleigh-Dickinson | 93 | Army | 84 | 566 | Rothman Center | 5000 | 11.3% |
| 12/15/2018 | Patriot League | Boston University | 75 | Nicholls State | 63 | 584 | Case Gym | 1800 | 32.4% |
| 12/14/2018 | Southland | Houston Baptist | 107 | Arlington Baptist | 70 | 601 | Sharp Gymnasium | 1500 | 40.1% |
| 12/10/2018 | MAAC | Manhattan | 50 | Hofstra | 80 | 602 | Draddy Gymnasium | 2345 | 25.7% |
| 12/15/2018 | Northeast | Fairleigh-Dickinson | 80 | NJIT | 90 | 612 | Rothman Center | 5000 | 12.2% |
| 12/15/2018 | MEAC | Bethune-Cookman | 71 | Jacksonville | 79 | 617 | Moore Gymnasium (Daytona Beach, FL) | 3000 | 20.6% |
| 12/15/2018 | Southland | Northwestern State | 69 | Southern | 66 | 617 | Gold Dome | 3000 | 20.6% |
| 12/13/2018 | Conference USA | Florida International | 102 | North Florida | 89 | 622 | Ocean Bank Convocation Center | 6000 | 10.4% |
| 12/15/2018 | Atlantic Sun | South Carolina Upstate | 88 | South Carolina State | 84 | 665 | Hodge Center | 878 | 75.7% |
| 12/15/2018 | Western Athletic | UTRGV | 68 | Texas State | 77 | 733 | UTRGV Fieldhouse | 2500 | 29.3% |
| 12/13/2018 | West Coast | Santa Clara | 82 | Mississippi Valley State | 54 | 862 | Leavey Center | 5000 | 17.2% |
| 12/11/2018 | Ivy League | Yale | 71 | Albany | 63 | 904 | John J. Lee Amphitheater | 2532 | 35.7% |
| 12/15/2018 | Southern | The Citadel | 86 | Southeast Missouri State | 74 | 922 | McAlister Field House | 6000 | 15.4% |
| 12/12/2018 | Horizon League | IUPUI | 116 | Indiana-Northwest | 79 | 927 | Indiana Farmers Coliseum | 6500 | 14.3% |
| 12/15/2018 | Horizon League | IUPUI | 82 | Western Illinois | 68 | 980 | Indiana Farmers Coliseum | 6500 | 15.1% |
| 12/13/2018 | Western Athletic | UMKC | 66 | Milwaukee | 69 | 987 | Municipal Auditorium (MO) | 7300 | 13.5% |
| 12/11/2018 | Sun Belt | Little Rock | 67 | Miles | 47 | 1008 | Jack Stephens Center | 5600 | 18.0% |
| 12/15/2018 | Western Athletic | UMKC | 80 | McNeese State | 67 | 1012 | Municipal Auditorium (MO) | 7300 | 13.9% |
| 12/14/2018 | Sun Belt | Georgia Southern | 101 | Brewton-Parker | 64 | 1019 | W. S. Hanner Fieldhouse | 4325 | 23.6% |
| 12/10/2018 | America East | Maine | 98 | Maine-Machias | 43 | 1025 | Cross Insurance Center | 5800 | 17.7% |
| 12/15/2018 | Ohio Valley | Tennessee-Martin | 108 | Brescia | 79 | 1061 | Skyhawk Arena | 5000 | 21.2% |
| 12/13/2018 | Big South | Gardner-Webb | 81 | Kennesaw State | 77 | 1069 | Paul Porter Arena | 5000 | 21.4% |
| 12/14/2018 | Sun Belt | Arkansas State | 75 | Florida Atlantic | 71 | 1116 | First National Bank Arena | 10475 | 10.7% |
| 12/11/2018 | Horizon League | Green Bay | 112 | Wisconsin-Stout | 46 | 1152 | Kress Events Center | 4018 | 28.7% |
| 12/13/2018 | Southern | Samford | 77 | Morehead State | 72 | 1172 | Pete Hanna Center | 4974 | 23.6% |
| 12/12/2018 | Colonial Athletic | Georgia State | 95 | Chattanooga | 88 | 1197 | GSU Sports Arena | 4500 | 26.6% |
| 12/15/2018 | Atlantic Sun | Kennesaw State | 73 | Tennessee Tech | 68 | 1203 | KSU Convocation Center | 4792 | 25.1% |
| 12/15/2018 | Big South | High Point | 86 | Western Carolina | 59 | 1211 | Millis Athletic Center | 1750 | 69.2% |
| 12/15/2018 | Northeast | Mount St Mary’s | 74 | Wilson | 59 | 1223 | Knott Arena | 3121 | 39.2% |
| 12/13/2018 | Big South | Campbell | 100 | Central Penn | 53 | 1236 | Pope Convocation Center | 3095 | 39.9% |
| 12/13/2018 | Atlantic Sun | North Alabama | 90 | Huntingdon | 58 | 1244 | Flowers Hall | 4000 | 31.1% |
| 12/15/2018 | Atlantic Sun | North Florida | 68 | Charleston Southern | 61 | 1282 | UNF Arena | 5800 | 22.1% |
| 12/15/2018 | Ohio Valley | Austin Peay | 95 | Purdue Fort Wayne | 68 | 1344 | Winfield Dunn Center | 7257 | 18.5% |
| 12/13/2018 | Atlantic 10 | Duquesne | 72 | Maryland-Eastern Shore | 57 | 1346 | A.J. Palumbo Center | 4406 | 30.5% |
| 12/15/2018 | MAAC | Rider | 69 | Robert Morris | 50 | 1425 | Alumni Gymnasium (Rider) | 1650 | 86.4% |
| 12/14/2018 | Big Sky | North Dakota | 83 | Mayville St | 66 | 1472 | Betty Engelstad Sioux Center | 3300 | 44.6% |
| 12/16/2018 | Atlantic 10 | Duquesne | 72 | Maine | 46 | 1487 | A.J. Palumbo Center | 4406 | 33.7% |
| 12/12/2018 | Sun Belt | Troy | 88 | Carver Bible College | 43 | 1512 | Trojan Arena | 4000 | 37.8% |
| 12/15/2018 | America East | Binghamton | 48 | Youngstown State | 58 | 1527 | Events Center (Binghamton) | 5142 | 29.7% |
| 12/15/2018 | Southern | UNC-Greensboro | 53 | North Alabama | 48 | 1545 | Michael B. Fleming Gymnasium | 2320 | 66.6% |
| 12/15/2018 | Southern | Wofford | 92 | UNC-Asheville | 49 | 1555 | Jerry Richardson Indoor Stadium | 3400 | 45.7% |
| 12/12/2018 | Summit League | South Dakota | 78 | Bellevue | 52 | 1569 | Sanford Coyote Sports Center | 6000 | 26.2% |
| 12/12/2018 | MAAC | Rider | 81 | Norfolk State | 71 | 1587 | Alumni Gymnasium (Rider) | 1650 | 96.2% |
| 12/15/2018 | Horizon League | Detroit | 61 | Ohio | 63 | 1656 | Calihan Hall | 8295 | 20.0% |
| 12/11/2018 | Big South | Liberty | 79 | South Carolina State | 55 | 1684 | Vines Center | 8085 | 20.8% |
| 12/10/2018 | Ivy League | Dartmouth | 82 | Sacred Heart | 73 | 1718 | Edward Leede Arena | 2100 | 81.8% |
| 12/15/2018 | America East | Albany | 52 | Dartmouth | 61 | 1740 | SEFCU Arena | 4538 | 38.3% |
| 12/11/2018 | Atlantic 10 | Fordham | 50 | NJIT | 53 | 1766 | Rose Hill Gymnasium | 3470 | 50.9% |
| 12/15/2018 | Big Sky | Southern Utah | 78 | Pepperdine | 69 | 1772 | America First Events Center | 5300 | 33.4% |
| 12/11/2018 | Summit League | South Dakota State | 139 | Savannah State | 72 | 1776 | Frost Arena | 6500 | 27.3% |
| 12/11/2018 | Conference USA | Louisiana Tech | 96 | Mississippi Valley State | 80 | 1816 | Thomas Assembly Center | 8098 | 22.4% |
| 12/12/2018 | Southern | UNC-Greensboro | 77 | Coppin State | 54 | 1877 | Greensboro Coliseum | 21273 | 8.8% |
| 12/13/2018 | Southland | McNeese State | 77 | North Carolina Central | 61 | 1973 | H&HP Complex | 3800 | 51.9% |
| 12/15/2018 | Conference USA | Rice | 89 | UC-Santa Barbara | 99 | 2000 | Tudor Fieldhouse | 5750 | 34.8% |
| 12/11/2018 | Conference USA | Southern Miss | 81 | Millsaps | 47 | 2013 | Reed Green Coliseum | 8095 | 24.9% |
| 12/15/2018 | Sun Belt | Louisiana-Monroe | 74 | Stephen F. Austin | 58 | 2057 | Fant-Ewing Coliseum | 7085 | 29.0% |
| 12/15/2018 | Big South | Liberty | 96 | Kentucky Christian | 55 | 2115 | Vines Center | 8085 | 26.2% |
| 12/11/2018 | Southern | Furman | 77 | Charleston Southern | 69 | 2210 | Timmons Arena | 4000 | 55.3% |
| 12/10/2018 | SWAC | Arkansas-Pine Bluff | 84 | Champion Christian | 51 | 2259 | H. O. Clemmons Arena | 4500 | 50.2% |
| 12/15/2018 | Southern | Furman | 93 | UNC-Wilmington | 50 | 2457 | Timmons Arena | 4000 | 61.4% |
| 12/12/2018 | America East | Stony Brook | 83 | LIU Brooklyn | 79 | 2475 | Island FCU Arena | 4000 | 61.9% |
| 12/11/2018 | America East | UMBC | 76 | Towson | 80 | 2476 | RAC Arena | 4024 | 61.5% |
| 12/14/2018 | Atlantic 10 | George Washington | 70 | Howard | 64 | 2630 | Charles E. Smith Center | 4338 | 60.6% |
| 12/15/2018 | MAC | Akron | 74 | Marshall | 75 | 2748 | James A. Rhodes Arena | 5500 | 50.0% |
| 12/13/2018 | Horizon League | Wright State | 91 | Northwest Ohio | 52 | 3169 | Nutter Center | 10400 | 30.5% |
| 12/11/2018 | Sun Belt | Louisiana | 122 | Prairie View A&M | 90 | 3227 | Cajundome | 13500 | 23.9% |
| 12/12/2018 | ACC | Boston College | 82 | Columbia | 73 | 3295 | Silvio Conte Forum | 8606 | 38.3% |
| 12/11/2018 | Mountain West | Wyoming | 87 | Denver | 90 | 3422 | Arena-Auditorium | 15028 | 22.8% |
| 12/12/2018 | Mountain West | Boise State | 67 | Alabama State | 57 | 3476 | Taco Bell Arena | 12480 | 27.9% |
| 12/12/2018 | SEC | Ole Miss | 69 | Southeastern Louisiana | 47 | 3564 | Mississippi Coliseum | 6500 | 54.8% |
| 12/13/2018 | The American | Tulsa | 70 | New Orleans | 60 | 3570 | Reynolds Center | 8355 | 42.7% |
| 12/15/2018 | MEAC | Hampton | 72 | St. Leo | 60 | 3612 | Convocation Center (VA) | 7200 | 50.2% |
| 12/15/2018 | Ohio Valley | Murray State | 74 | Jackson State | 57 | 3612 | CFSB Center | 8602 | 42.0% |
| 12/11/2018 | The American | Central Florida | 95 | Georgia Southern | 88 | 3632 | CFE Arena | 9465 | 38.4% |
| 12/15/2018 | Pac 12 | Stanford | 78 | Eastern Washington | 62 | 3663 | Maples Pavilion | 7329 | 50.0% |
| 12/12/2018 | Big East | DePaul | 104 | Chicago State | 70 | 3729 | Wintrust Arena | 10387 | 35.9% |
| 12/15/2018 | Sun Belt | Louisiana | 62 | Louisiana Tech | 83 | 3732 | Cajundome | 13500 | 27.6% |
| 12/14/2018 | Big East | DePaul | 90 | UL Lafayette | 70 | 4136 | Wintrust Arena | 10387 | 39.8% |
| 12/15/2018 | MAC | Toledo | 84 | Middle Tennessee | 62 | 4205 | Savage Arena | 9000 | 46.7% |
| 12/15/2018 | ACC | Pittsburgh | 78 | Maryland-Eastern Shore | 43 | 4472 | Petersen Events Center | 12508 | 35.8% |
| 12/13/2018 | Conference USA | Rice | 78 | St. Edward’s | 73 | 4786 | Tudor Fieldhouse | 5750 | 83.2% |
| 12/15/2018 | Missouri Valley | Evansville | 50 | Jacksonville State | 55 | 4814 | Ford Center | 10000 | 48.1% |
| 12/12/2018 | The American | Temple | 65 | Massachusetts | 63 | 4840 | Liacouras Center | 10206 | 47.4% |
| 12/12/2018 | Missouri Valley | Southern Illinois | 52 | Murray State | 80 | 5107 | SIU Arena | 8339 | 61.2% |
| 12/15/2018 | Atlantic 10 | Richmond | 52 | Oral Roberts | 59 | 5107 | Robins Center | 9071 | 56.3% |
| 12/15/2018 | Missouri Valley | Bradley | 66 | Eastern Illinois | 73 | 5186 | Carver Arena | 11164 | 46.5% |
| 12/15/2018 | Pac 12 | Washington | 61 | Virginia Tech | 73 | 5456 | Boardwalk Hall | 10500 | 52.0% |
| 12/15/2018 | Mountain West | Utah State | 86 | Alabama State | 48 | 6078 | Dee Glen Smith Spectrum | 10270 | 59.2% |
| 12/10/2018 | Conference USA | Marshall | 76 | Morehead State | 64 | 6253 | Cam Henderson Center | 10705 | 58.4% |
| 12/15/2018 | The American | Connecticut | 61 | Manhattan | 46 | 6359 | Gampel Pavilion | 10167 | 62.5% |
| 12/15/2018 | Big East | Georgetown | 73 | SMU | 81 | 6763 | Capital One Arena | 20356 | 33.2% |
| 12/15/2018 | Big Sky | Weber State | 63 | Utah Valley | 75 | 7021 | Dee Events Center | 11500 | 61.1% |
| 12/15/2018 | Big 12 | Texas Tech | 82 | Abilene Christian | 48 | 7169 | Lubbock Municipal Coliseum | 8344 | 85.9% |
| 12/15/2018 | ACC | Clemson | 74 | Radford | 66 | 7225 | Littlejohn Coliseum | 9000 | 80.3% |
| 12/15/2018 | Atlantic 10 | Virginia Commonwealth | 79 | Charleston | 83 | 7637 | Stuart C. Siegel Center | 7637 | 100.0% |
| 12/11/2018 | Ivy League | Penn | 78 | Villanova | 75 | 8033 | The Palestra | 8722 | 92.1% |
| 12/15/2018 | Pac 12 | UCLA | 72 | Belmont | 74 | 8037 | Pauley Pavilion | 12829 | 62.6% |
| 12/15/2018 | Big 12 | Texas | 98 | Grand Canyon | 60 | 8265 | Frank Erwin Center | 16837 | 49.1% |
| 12/15/2018 | SEC | Georgia | 74 | Arizona State | 76 | 9028 | Stegeman Coliseum | 11200 | 80.6% |
| 12/15/2018 | SEC | Mississippi State | 70 | Cincinnati | 59 | 9120 | Humphrey Coliseum | 10575 | 86.2% |
| 12/15/2018 | The American | Wichita State | 63 | Southern Miss | 60 | 9356 | Charles Koch Arena | 10506 | 89.1% |
| 12/15/2018 | Big 12 | Kansas State | 71 | Georgia State | 59 | 9563 | Bramlage Coliseum | 13762 | 69.5% |
| 12/12/2018 | The American | Wichita State | 69 | Jacksonville State | 65 | 10028 | Charles Koch Arena | 10506 | 95.5% |
| 12/12/2018 | Big 12 | Texas Tech | 79 | Northwestern State | 44 | 10086 | United Supermarkets Arena | 15020 | 67.2% |
| 12/15/2018 | Big East | Xavier | 95 | Eastern Kentucky | 77 | 10112 | Cintas Center | 10250 | 98.7% |
| 12/15/2018 | Big East | Seton Hall | 72 | Rutgers | 66 | 10481 | Prudential Center | 17625 | 59.5% |
| 12/15/2018 | Mountain West | Nevada | 72 | South Dakota State | 68 | 11257 | Lawlor Events Center | 11536 | 97.6% |
| 12/12/2018 | West Coast | BYU | 85 | Portland State | 66 | 11563 | Marriott Center | 22700 | 50.9% |
| 12/11/2018 | Big Ten | Maryland | 94 | Loyola-Maryland | 71 | 11595 | XFINITY Center | 17950 | 64.6% |
| 12/15/2018 | Missouri Valley | Northern Iowa | 54 | Iowa | 77 | 12236 | Wells Fargo Arena (IA) | 16110 | 76.0% |
| 12/15/2018 | Big Ten | Illinois | 73 | East Tennessee State | 55 | 12379 | State Farm Center | 15500 | 79.9% |
| 12/15/2018 | Big Ten | Michigan | 70 | Western Michigan | 62 | 12707 | Crisler Center | 12707 | 100.0% |
| 12/15/2018 | SEC | Arkansas | 79 | UTSA | 67 | 13728 | Verizon Arena | 18000 | 76.3% |
| 12/12/2018 | ACC | Louisville | 72 | Lipscomb | 68 | 14197 | KFC Yum! Center | 22090 | 64.3% |
| 12/15/2018 | Big Ten | Ohio State | 73 | Bucknell | 71 | 14241 | Value City Arena | 18809 | 75.7% |
| 12/15/2018 | ACC | Louisville | 83 | Kent State | 70 | 15117 | KFC Yum! Center | 22090 | 68.4% |
| 12/15/2018 | Conference USA | UAB | 71 | Auburn | 75 | 15856 | Legacy Arena at BJCC | 17654 | 89.8% |
| 12/15/2018 | Big 12 | Kansas | 74 | Villanova | 71 | 16300 | Allen Fieldhouse | 16300 | 100.0% |
| 12/13/2018 | Big Ten | Wisconsin | 101 | Savannah State | 60 | 17004 | Kohl Center | 17230 | 98.7% |
| 12/14/2018 | Big East | Creighton | 86 | Green Bay | 65 | 17147 | CHI Health Center Omaha | 18320 | 93.6% |
| 12/15/2018 | ACC | Syracuse | 62 | Old Dominion | 68 | 17585 | Carrier Dome | 35446 | 49.6% |
| 12/15/2018 | Big East | Butler | 68 | Indiana | 71 | 18743 | Bankers Life Fieldhouse | 18165 | 103.2% |
| 12/15/2018 | ACC | North Carolina | 103 | Gonzaga | 90 | 21750 | Dean E. Smith Center | 21750 | 100.0% |
| 12/15/2018 | SEC | Kentucky | 88 | Utah | 61 | 21922 | Rupp Arena | 23500 | 93.3% |