It’s 1998 all over again. Home runs are once again en vogue, with 2017 trending to have the most home runs in MLB history. It’s to the point where after last week’s bomb show by Scooter Gennett that many are offering odds on the next player to hit four home runs, with Nolan Arenado and Mike Trout listed as favorites. Unlike 1998, we likely won’t have to hear the testimony of current players in the next Balco scandal, as the distribution of home runs throughout the league is rising at a relatively level pace, not just a few monsters hitting 50+ home runs1.
But what if we were to look at every home run that has been hit since 19522 and the various situations that these homers were hit? It’s time to take a look at all 231,877 home runs hit from 1952-2016.
First off, let’s look at runners on base. It’s pretty expected, with solo homers being the most prevalent, and an almost perfect exponential decay:
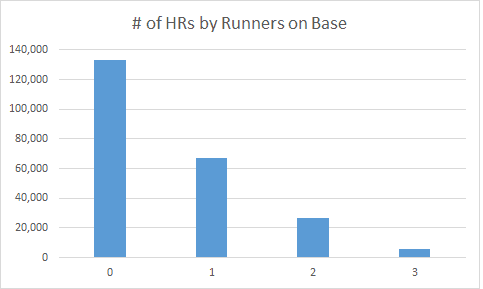
| Runners on base | # of HRs |
| 0 | 133,018 |
| 1 | 67,017 |
| 2 | 26,375 |
| 3 | 5,467 |
Another logical progression is to look at number of outs when the home run was hit, which is fairly logical as it is fairly consistent with a slight decay as outs increase:
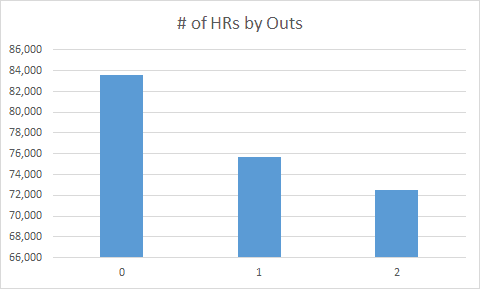
| Outs | # of HRs |
| 0 | 83,606 |
| 1 | 75,716 |
| 2 | 72,555 |
So what happens when we combine the two? It’s pretty interesting, as the highest number of grand slams occurs with two outs, while zero out home runs are more likely to be solo shots (which, of course, makes sense):
| Runners on base | |||||
| 0 | 1 | 2 | 3 | ||
| Outs | 0 | 61,324 | 16354 | 5038 | 890 |
| 1 | 39,590 | 24329 | 9689 | 2108 | |
| 2 | 32,104 | 26334 | 11648 | 2469 | |
Another interesting slice of the data is to take a look at which inning home runs have occurred in. Again we see a logical trend in that the 1st, 4th, and 6th innings seem to see a peak in home runs, where one would expect the 3rd and 4th spots in the lineup to be hitting. What was interesting to me as well is that the 23rd inning is the first inning to not have a home run ever hit in it, though the 25th has seen a homer. Overall, the innings distribution is a thing of statistical art, with a beautiful tail from the 8th inning onwards.
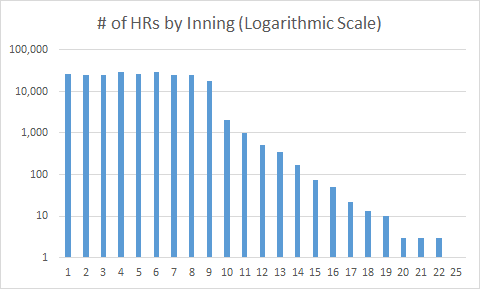
| Inning | # of HRs |
| 1 | 26,084 |
| 2 | 24,709 |
| 3 | 24,778 |
| 4 | 29,284 |
| 5 | 26,006 |
| 6 | 28,676 |
| 7 | 25,426 |
| 8 | 24,382 |
| 9 | 18,264 |
| 10 | 2,016 |
| 11 | 1,025 |
| 12 | 527 |
| 13 | 349 |
| 14 | 172 |
| 15 | 75 |
| 16 | 49 |
| 17 | 22 |
| 18 | 13 |
| 19 | 10 |
| 20 | 3 |
| 21 | 3 |
| 22 | 3 |
| 25 | 1 |
As for what counts most home runs have occurred on? Well, it’s hard to say, because the pitch counts are not available for many of the older games in the data set. However, we can still see that homers drop dramatically on 3-0 and 0-2 counts, and actually go up slightly between 2-2 and 3-2 counts.
| Strikes | ||||
| 0 | 1 | 2 | ||
| Balls | 0 | 116,149 | 13,293 | 4,666 |
| 1 | 17,610 | 15,683 | 10,405 | |
| 2 | 8,298 | 12,062 | 12,555 | |
| 3 | 904 | 7,299 | 12,953 | |
And finally, we have the matchups. Unsurprisingly, right-handed hitters have hit more home runs than left-handed hitters, due to the higher number of righties. The same holds true for pitchers, with righties giving up almost 150% more home runs than their left-handed counterparts. When we merge the two, we see a fairly uniform distribution
Batter handedness:
| L | 91148 |
| R | 140729 |
Pitcher handedness:
| L | 65394 |
| R | 166483 |
Combined batter vs pitcher:
| Pitcher | |||
| L | R | ||
| Batter | L | 13,592 | 77,556 |
| R | 51,802 | 88,927 | |
So what does this tell us? I guess we can say that with no outs and nobody on in the first, fourth, or sixth inning with a 1-0 count, you should absolutely prepare yourself for a homer. Or perhaps that when you look at 231,877 home runs, the general trends tend to even themselves out from a statistical perspective. Interestingly, the variance in outs leading to slightly fewer home runs seems interesting as there’s no logical conclusion I can think of as to why home runs would be less likely with two outs (I suppose trying to extend an inning with a single may account for some of that).
Stay tuned for next week’s edition as we take a look at every hit since 1952.
Notice any trends? Post a comment below!