The college basketball season has begun, and with it brings plenty of random tournaments nationwide. Some of these, like the Maui Invitational, bring the best teams together and have no problem selling out. Others, well… we’ll get to those. Let’s take a look:
Number of games drawing fewer than 1,000 fans: 89 (Season total: 89)
Here are the 3 lowest attended games of last week:
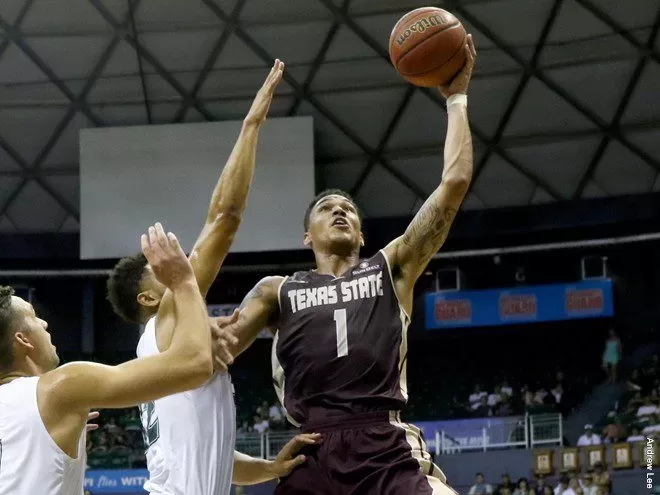
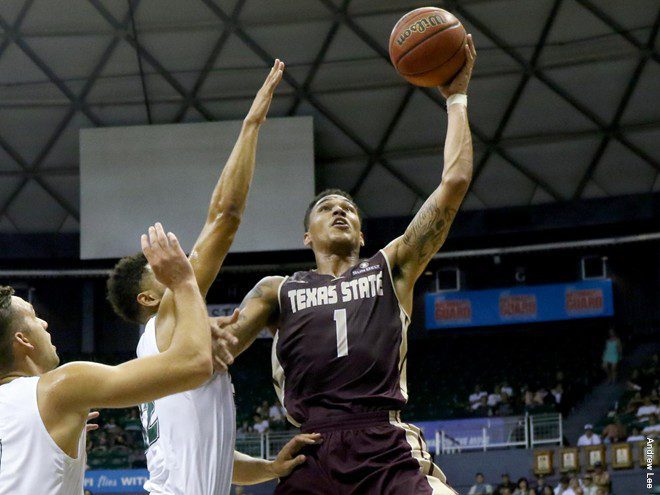
3. SIU-Edwardsville vs Texas State – This one took place in the Stan Sheriff Center in Honolulu and had the prestigious title of being the lowest attended game as a percent of stadium capacity, as only 110 showed up in the 10,300 seat arena to see these two regional powerhouses square off thousands of miles from their nearest fans. Though I will say from the one sliver of a crowd shot I was able to find, it seems the attendance might’ve been a bit higher (For those who care, the Bobcats beat SIU-E 86-58):
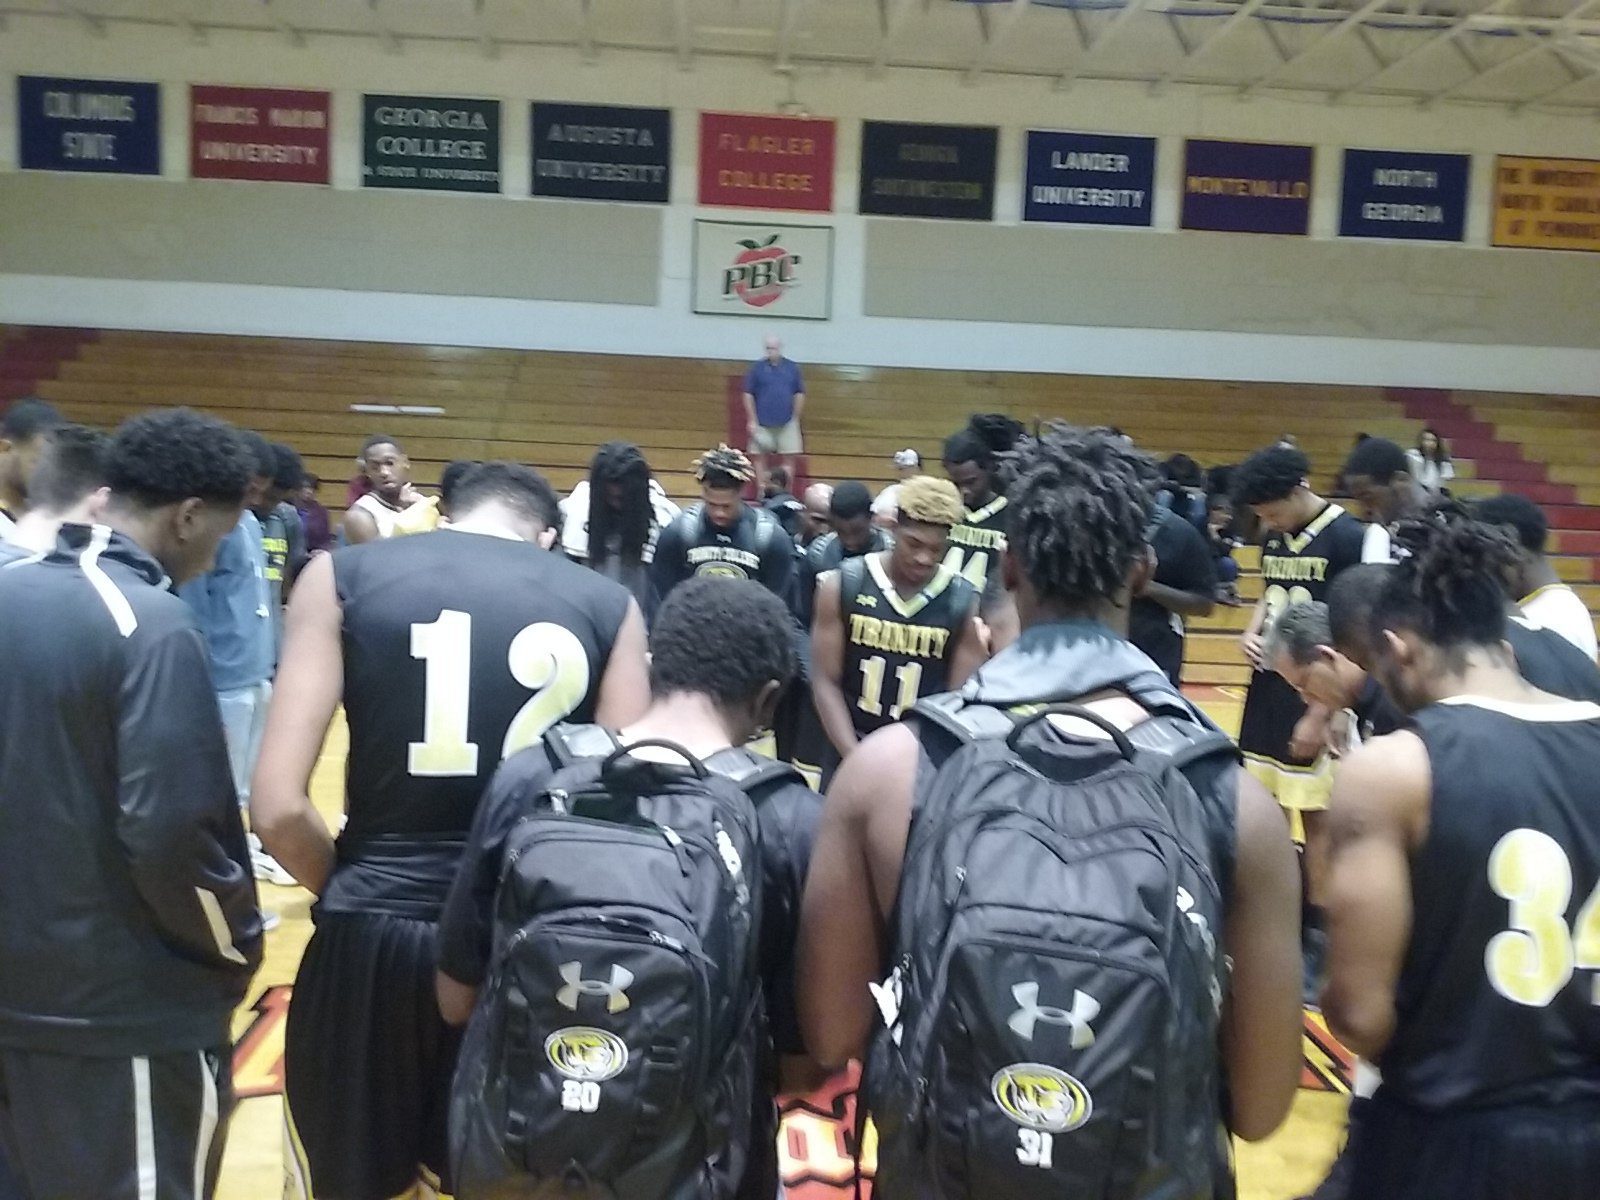
2. Bethune-Cookman vs Trinity Baptist – Editor note: After publication, it came to our attention that BCU’s home arena, Moore Gymnasium, was damaged in a recent hurricane and games are being played an hour or so away in St. Augustine, partially explaining the lower attendance. Original comment follows: Our first sub-100 attended game of the season took place on the 18th as Bethune-Cookman hosted Trinity Bible College. SIXTY SEVEN people showed up, and from the looks of it, most of them didn’t hang around for the prayer circle after the 82-52 B-C win:
1. LIU-Brooklyn vs Maine – Fifty two fans. That’s it. The teams dressed 21 players, plus a couple of head coaches and assistants. That gives you roughly twice as many fans as participants watching this game, part of the Steve Wright Classic, an early season tournament hosted by Boston University. Apparently not many cared to drive up from New York, or down from Orono to see these two heavyweights battle it out. Those who were in attendance were at least treated to a close game: LIU-B won by 5.
And now, as always, the miscellany:
Biggest group of people to see a loss at home this week: BYU (vs Princeton) 15,926.
Smallest group of people to see a win at home this week (including neutral sites): LIU-Brooklyn (vs Maine), 52.
Smallest group of people to see a win at home this week (on campus): Bethune-Cookman(vs Trinity Bible), 67.
Smallest Power Conference attendance (including neutral sites): Washington State (vs Loyola (Chicago)), 224.
Smallest Power Conference attendance (on campus): Stanford (vs Weber State), 1,232.
Average attendance this week: 4,867.
And as always, your full attendance numbers for the week:
| Date | Conference | Home Team | Home Score | Away Team | Away Score | Attendance | Venue | Capacity | % Full |
|---|---|---|---|---|---|---|---|---|---|
| 11/21/2016 | Northeast | LIU Brooklyn | 71 | Maine | 66 | 52 | Case Gym | 1800 | 2.9% |
| 11/18/2016 | MEAC | Bethune-Cookman | 82 | Trinity Baptist | 52 | 67 | Moore Gymnasium | 3000 | 2.2% |
| 11/14/2016 | Ohio Valley | SIU ED | 58 | Texas State | 86 | 110 | Stan Sheriff Center | 10300 | 1.1% |
| 11/20/2016 | Sun Belt | Arkansas State | 73 | Chattanooga | 67 | 120 | Christl Arena | 5043 | 2.4% |
| 11/21/2016 | Pac 12 | Washington St | 79 | Loyola (CHI) | 88 | 224 | Sports and Fitness Center | 3500 | 6.4% |
| 11/21/2016 | Western Athletic | Seattle | 81 | UL Monroe | 75 | 300 | Reese Court | 6000 | 5.0% |
| 11/15/2016 | Southland | McNeese | 75 | Louisiana Coll. | 85 | 323 | Burton Coliseum | 6500 | 5.0% |
| 11/14/2016 | MEAC | S Carolina St | 93 | St. Andrews | 76 | 392 | S-H-M Memorial Center | 3200 | 12.3% |
| 11/19/2016 | Ohio Valley | E Illinois | 73 | W Illinois | 64 | 392 | Lantz Arena | 5300 | 7.4% |
| 11/21/2016 | Southland | Incarnate Word | 91 | Howard Payne | 61 | 400 | McDermott Convocation Center | 2000 | 20.0% |
| 11/18/2016 | Southland | Houston Baptist | 98 | Dallas Christ. | 54 | 422 | Sharp Gymnasium | 1500 | 28.1% |
| 11/15/2016 | Ivy League | Dartmouth | 62 | Fairfield | 79 | 433 | Edward Leede Arena | 2100 | 20.6% |
| 11/17/2016 | Big Sky | Portland State | 113 | George Fox | 81 | 440 | Stott Center | 1500 | 29.3% |
| 11/17/2016 | Big Sky | Sacramento St | 82 | Antelope | 60 | 459 | The Nest | 900 | 51.0% |
| 11/20/2016 | Patriot League | Boston U | 86 | LIU Brooklyn | 69 | 460 | Case Gym | 1800 | 25.6% |
| 11/17/2016 | America East | UNH | 57 | Abil Christian | 65 | 473 | Lundholm Gymnasium | 6501 | 7.3% |
| 11/18/2016 | SEC | Ole Miss | 95 | Oral Roberts | 88 | 512 | Sports and Fitness Center | 3500 | 14.6% |
| 11/13/2016 | Big West | CS Fullerton | 106 | Portland State | 100 | 517 | Titan Gym | 5015 | 10.3% |
| 11/15/2016 | Northeast | Bryant | 88 | Regina | 61 | 565 | Chace Athletic Center | 2700 | 20.9% |
| 11/11/2016 | Big West | CS Fullerton | 77 | Caltech | 28 | 567 | Titan Gym | 5015 | 11.3% |
| 11/13/2016 | Summit League | W Illinois | 95 | Oak Hills Chr. | 48 | 572 | Western Hall | 5139 | 11.1% |
| 11/14/2016 | SWAC | AR-Pine Bluff | 83 | Ecclesia College | 47 | 575 | H. O. Clemmons Arena | 4500 | 12.8% |
| 11/15/2016 | Northeast | Sacred Heart | 90 | Hofstra | 86 | 579 | William H. Pitt Center | 2062 | 28.1% |
| 11/20/2016 | Southland | McNeese | 96 | Southern-New Orleans | 73 | 597 | Burton Coliseum | 6500 | 9.2% |
| 11/11/2016 | Northeast | LIU Brooklyn | 78 | John Jay College of | 40 | 598 | Wellness, Recreation and Athletic Center | 2500 | 23.9% |
| 11/18/2016 | Big Sky | Southern Utah | 108 | Bethesda | 92 | 600 | Centrum Arena | 5300 | 11.3% |
| 11/11/2016 | Sun Belt | UL Monroe | 96 | Centenary | 63 | 607 | Fant-Ewing Coliseum | 7085 | 8.6% |
| 11/16/2016 | America East | UMBC | 90 | Delaware State | 68 | 612 | RAC Arena | 4024 | 15.2% |
| 11/19/2016 | Big South | Charleston So | 77 | USC Upstate | 79 | 616 | CSU Field House | 881 | 69.9% |
| 11/11/2016 | America East | UMBC | 92 | Hood | 61 | 617 | RAC Arena | 4024 | 15.3% |
| 11/12/2016 | Big Sky | Idaho | 90 | Corban U | 67 | 628 | Cowan Spectrum | 7000 | 9.0% |
| 11/11/2016 | America East | UNH | 85 | Lesley University | 60 | 632 | Lundholm Gymnasium | 6501 | 9.7% |
| 11/14/2016 | MAAC | St Peter’s | 57 | Lafayette | 61 | 632 | Yanitelli Center | 3200 | 19.8% |
| 11/20/2016 | Patriot League | Army | 76 | Cent Arkansas | 81 | 670 | Christl Arena | 5043 | 13.3% |
| 11/19/2016 | Colonial Athletic | Northeastern | 74 | LIU Brooklyn | 78 | 672 | Case Gym | 1800 | 37.3% |
| 11/21/2016 | SWAC | AR-Pine Bluff | 74 | Blue Mountain | 77 | 675 | H. O. Clemmons Arena | 4500 | 15.0% |
| 11/16/2016 | MEAC | Bethune-Cookman | 75 | Kennesaw St | 72 | 678 | Moore Gymnasium | 3000 | 22.6% |
| 11/14/2016 | Atlantic Sun | Stetson | 82 | FIU | 67 | 682 | Edmunds Center | 5000 | 13.6% |
| 11/15/2016 | Southland | Incarnate Word | 93 | St. Edward’s | 90 | 685 | McDermott Convocation Center | 2000 | 34.3% |
| 11/21/2016 | Southland | SE Louisiana | 89 | Xavier LA | 72 | 696 | University Center (LA) | 7500 | 9.3% |
| 11/19/2016 | Northeast | St Francis (PA) | 119 | Chatham | 59 | 714 | DeGol Arena | 3500 | 20.4% |
| 11/19/2016 | America East | UMBC | 93 | Kennesaw St | 85 | 719 | RAC Arena | 4024 | 17.9% |
| 11/18/2016 | SWAC | Alcorn State | 93 | Selma | 48 | 726 | Davey Whitney Complex | 7000 | 10.4% |
| 11/11/2016 | Southland | New Orleans | 103 | LaGrange College | 67 | 739 | Lakefront Arena | 10000 | 7.4% |
| 11/15/2016 | Patriot League | Army | 91 | Mt St Mary NY | 53 | 747 | Christl Arena | 5043 | 14.8% |
| 11/11/2016 | Mountain West | Air Force | 88 | McPherson College | 71 | 750 | Clune Arena | 5858 | 12.8% |
| 11/14/2016 | MAC | N Illinois | 99 | Roosevelt | 55 | 756 | NIU Convocation Center | 10000 | 7.6% |
| 11/13/2016 | Ivy League | Brown | 88 | Niagara | 79 | 757 | Pizzitola Sports Center | 2800 | 27.0% |
| 11/16/2016 | Northeast | LIU Brooklyn | 65 | Loyola (MD) | 61 | 762 | Barclays Center | 17732 | 4.3% |
| 11/20/2016 | Ohio Valley | Tenn Tech | 71 | Sam Houston | 78 | 768 | Hooper Eblen Center | 9282 | 8.3% |
| 11/15/2016 | Mountain West | Air Force | 105 | Johnson & Wales | 62 | 782 | Clune Arena | 5858 | 13.3% |
| 11/18/2016 | Atlantic 10 | Duquesne | 77 | Canisius | 78 | 786 | A.J. Palumbo Center | 4406 | 17.8% |
| 11/19/2016 | Atlantic Sun | NJIT | 74 | Colgate | 68 | 802 | Fleisher Center | 1500 | 53.5% |
| 11/21/2016 | MAAC | Quinnipiac | 78 | Columbia | 86 | 802 | TD Bank Sports Center | 3570 | 22.5% |
| 11/19/2016 | MEAC | Morgan State | 82 | Campbell | 66 | 804 | Hill Field House | 4250 | 18.9% |
| 11/13/2016 | Ohio Valley | SE Missouri St | 86 | Hannibal-LaGrange Co | 54 | 807 | Show Me Center | 6972 | 11.6% |
| 11/16/2016 | Summit League | W Illinois | 71 | SE Missouri St | 74 | 807 | Western Hall | 5139 | 15.7% |
| 11/11/2016 | MAC | Miami (OH) | 84 | Muskingum College | 57 | 809 | Millett Hall | 6400 | 12.6% |
| 11/14/2016 | Patriot League | Loyola (MD) | 79 | Millersv | 66 | 814 | Reitz Arena | 3000 | 27.1% |
| 11/11/2016 | Atlantic Sun | Stetson | 78 | Webber Int. | 62 | 820 | Edmunds Center | 5000 | 16.4% |
| 11/18/2016 | Atlantic Sun | Stetson | 112 | The Citadel | 116 | 822 | Edmunds Center | 5000 | 16.4% |
| 11/17/2016 | Big West | Cal Poly | 75 | CS Dom. Hills | 64 | 824 | Mott Athletics Center | 3032 | 27.2% |
| 11/20/2016 | Mountain West | Air Force | 87 | Florida A&M | 62 | 836 | Clune Arena | 5858 | 14.3% |
| 11/18/2016 | Summit League | IUPUI | 77 | Howard | 55 | 843 | Indiana Farmers Coliseum | 6500 | 13.0% |
| 11/18/2016 | Patriot League | Boston U | 65 | Northeastern | 63 | 843 | Case Gym | 1800 | 46.8% |
| 11/17/2016 | Southland | Nicholls | 86 | Miss. College | 55 | 847 | Stopher Gymnasium | 3800 | 22.3% |
| 11/20/2016 | West Coast | San Diego | 81 | Nicholls | 72 | 849 | Jenny Craig Pavilion | 5100 | 16.6% |
| 11/19/2016 | Summit League | IUPUI | 83 | E Michigan | 71 | 863 | Indiana Farmers Coliseum | 6500 | 13.3% |
| 11/16/2016 | America East | Hartford | 68 | Rider | 84 | 866 | Chase Arena | 4107 | 21.1% |
| 11/11/2016 | Sun Belt | Troy | 135 | Toccoa Falls | 76 | 867 | Trojan Arena | 4000 | 21.7% |
| 11/14/2016 | Mountain West | Air Force | 86 | Jacksonville | 68 | 870 | Clune Arena | 5858 | 14.9% |
| 11/19/2016 | Big West | CS Northridge | 84 | N Illinois | 82 | 886 | Matadome | 3106 | 28.5% |
| 11/17/2016 | MEAC | Morgan State | 88 | Wilmington (DE) | 73 | 895 | Hill Field House | 4250 | 21.1% |
| 11/15/2016 | Southern | VMI | 78 | Southern VA | 47 | 896 | Cameron Hall | 5020 | 17.8% |
| 11/13/2016 | Southern | The Citadel | 146 | Johnson Univ (FL) | 84 | 897 | McAlister Field House | 6000 | 15.0% |
| 11/15/2016 | MEAC | Florida A&M | 94 | Trinity Baptist | 62 | 897 | Al Lawson Center | 8470 | 10.6% |
| 11/20/2016 | Conference USA | FAU | 98 | Edward Waters | 64 | 903 | FAU Arena | 5000 | 18.1% |
| 11/14/2016 | Sun Belt | Troy | 70 | E Illinois | 67 | 905 | Trojan Arena | 4000 | 22.6% |
| 11/16/2016 | Southland | SE Louisiana | 84 | Jackson State | 71 | 907 | University Center (LA) | 7500 | 12.1% |
| 11/11/2016 | Conference USA | FIU | 76 | Florida Memorial | 57 | 908 | FIU Arena | 6000 | 15.1% |
| 11/15/2016 | Southern | The Citadel | 119 | Truett-McConnell | 90 | 908 | McAlister Field House | 6000 | 15.1% |
| 11/11/2016 | Big South | Presbyterian | 73 | Furman | 71 | 912 | Ross E. Templeton P.E. Center | 2300 | 39.7% |
| 11/11/2016 | MEAC | NC A&T | 67 | Greensboro | 50 | 917 | Corbett Sports Center | 5700 | 16.1% |
| 11/19/2016 | Patriot League | Army | 57 | Arkansas State | 60 | 921 | Christl Arena | 5043 | 18.3% |
| 11/19/2016 | Southern | Chattanooga | 75 | Cent Arkansas | 64 | 921 | Christl Arena | 5043 | 18.3% |
| 11/11/2016 | Southland | SE Louisiana | 85 | Millsaps | 39 | 930 | University Center (LA) | 7500 | 12.4% |
| 11/13/2016 | MEAC | Delaware State | 61 | Texas Southern | 74 | 942 | Memorial Hall (Dover, DE) | 3000 | 31.4% |
| 11/15/2016 | Northeast | Fair Dickinson | 96 | FDU-Florham | 48 | 943 | Rothman Center | 5000 | 18.9% |
| 11/17/2016 | West Coast | Pepperdine | 85 | Life Pacific | 79 | 985 | Firestone Fieldhouse | 4500 | 21.9% |
| 11/18/2016 | Big East | Xavier | 83 | Clemson | 77 | 1002 | HP Field House | 5000 | 20.0% |
| 11/20/2016 | Atlantic 10 | Fordham | 85 | Lipscomb | 69 | 1003 | Rose Hill Gymnasium | 3470 | 28.9% |
| 11/11/2016 | Big West | CS Northridge | 96 | Pomona P | 72 | 1006 | Matadome | 3106 | 32.4% |
| 11/16/2016 | Big Sky | N Colorado | 94 | CO Christian | 73 | 1008 | Bank of Colorado Arena | 4500 | 22.4% |
| 11/11/2016 | Horizon League | Detroit | 99 | Adrian | 69 | 1009 | Calihan Hall | 8295 | 12.2% |
| 11/15/2016 | West Coast | Pepperdine | 69 | Weber State | 68 | 1020 | Firestone Fieldhouse | 4500 | 22.7% |
| 11/17/2016 | SWAC | Grambling St | 59 | NC A&T | 55 | 1023 | Fredrick C. Hobdy Assembly Center | 7500 | 13.6% |
| 11/16/2016 | Atlantic 10 | Duquesne | 89 | St Francis (PA) | 75 | 1025 | A.J. Palumbo Center | 4406 | 23.3% |
| 11/11/2016 | Ohio Valley | E Illinois | 83 | St Francis (IL) | 41 | 1038 | Lantz Arena | 5300 | 19.6% |
| 11/21/2016 | Big South | Liberty | 84 | UMass Lowell | 77 | 1050 | Vines Center | 8085 | 13.0% |
| 11/15/2016 | MAAC | Manhattan | 81 | Winthrop | 94 | 1051 | Draddy Gymnasium | 2345 | 44.8% |
| 11/14/2016 | America East | UMass Lowell | 87 | Wagner | 76 | 1053 | Costello Athletic Center | 2100 | 50.1% |
| 11/17/2016 | Sun Belt | Appalachian St | 119 | Warren Wilson | 51 | 1057 | Holmes Convocation Center | 8325 | 12.7% |
| 11/17/2016 | Ivy League | Yale | 89 | Lehigh | 81 | 1062 | John J. Lee Amphitheater | 2532 | 41.9% |
| 11/12/2016 | Western Athletic | Chicago State | 97 | Illinois Tech | 89 | 1065 | Jones Convocation Center | 7000 | 15.2% |
| 11/19/2016 | Conference USA | UTSA | 69 | PV A&M | 59 | 1065 | UTSA Convocation Center | 4080 | 26.1% |
| 11/15/2016 | Ohio Valley | UT Martin | 95 | Cumberland TENN | 64 | 1067 | Skyhawk Arena | 5000 | 21.3% |
| 11/15/2016 | Southern | Wofford | 117 | Allen | 77 | 1087 | Benjamin Johnson Arena | 3500 | 31.1% |
| 11/13/2016 | Ohio Valley | UT Martin | 88 | UT Rio Grande | 80 | 1094 | Skyhawk Arena | 5000 | 21.9% |
| 11/20/2016 | Big South | High Point | 44 | North Dakota St | 70 | 1100 | Millis Athletic Center | 1750 | 62.9% |
| 11/13/2016 | West Coast | Santa Clara | 61 | Tennessee St | 69 | 1102 | Leavey Center | 5000 | 22.0% |
| 11/18/2016 | MAAC | Manhattan | 80 | Hofstra | 68 | 1109 | Draddy Gymnasium | 2345 | 47.3% |
| 11/16/2016 | MAAC | Marist | 72 | Vermont | 76 | 1112 | McCann Arena | 3200 | 34.8% |
| 11/17/2016 | Southland | Sam Houston | 91 | Southern | 83 | 1116 | Bernard G. Johnson Coliseum | 6110 | 18.3% |
| 11/13/2016 | Big South | Longwood | 58 | Maine | 80 | 1128 | Willett Hall | 2522 | 44.7% |
| 11/11/2016 | Colonial Athletic | Elon | 101 | William Peace | 68 | 1131 | Alumni Gym (Elon University) | 1585 | 71.4% |
| 11/13/2016 | Summit League | Fort Wayne | 117 | Kenyon | 60 | 1131 | Hilliard Gates Sports Center | 2300 | 49.2% |
| 11/17/2016 | MEAC | Savannah State | 101 | Mid Georgia St | 93 | 1134 | Tiger Arena | 6000 | 18.9% |
| 11/19/2016 | Western Athletic | Utah Valley | 86 | Benedictine (AZ) | 52 | 1140 | UCCU Center | 8500 | 13.4% |
| 11/15/2016 | Horizon League | Cleveland State | 67 | Canisius | 64 | 1149 | Wolstein Center | 13610 | 8.4% |
| 11/14/2016 | Big West | UC Irvine | 73 | South Dakota St | 58 | 1172 | Bren Events Center | 4984 | 23.5% |
| 11/18/2016 | Big South | Longwood | 87 | Salem International | 74 | 1187 | Willett Hall | 2522 | 47.1% |
| 11/19/2016 | Southern | Furman | 102 | Trinity Baptist | 53 | 1209 | Timmons Arena | 4000 | 30.2% |
| 11/21/2016 | Big Sky | E Washington | 81 | Bryant | 77 | 1221 | Reese Court | 6000 | 20.4% |
| 11/20/2016 | Big South | UNC Asheville | 92 | Siena | 80 | 1227 | Kimmel Arena | 3200 | 38.3% |
| 11/20/2016 | MAC | Miami (OH) | 70 | N Kentucky | 79 | 1229 | Millett Hall | 6400 | 19.2% |
| 11/15/2016 | Big South | Campbell | 101 | Bridgewater | 45 | 1232 | Pope Convocation Center | 3095 | 39.8% |
| 11/17/2016 | Pac 12 | Stanford | 67 | Weber State | 49 | 1232 | Maples Pavilion | 7329 | 16.8% |
| 11/14/2016 | The American | Tulane | 93 | SE Louisiana | 76 | 1239 | Devlin Fieldhouse | 3600 | 34.4% |
| 11/13/2016 | Patriot League | Navy | 74 | Wash. College | 47 | 1258 | Alumni Hall | 5710 | 22.0% |
| 11/19/2016 | MAC | Miami (OH) | 76 | Austin Peay | 70 | 1274 | Millett Hall | 6400 | 19.9% |
| 11/21/2016 | MAAC | Canisius | 69 | UT Martin | 72 | 1291 | Koessler Athletic Center | 2176 | 59.3% |
| 11/20/2016 | SEC | Miss St | 61 | UTEP | 54 | 1293 | TD Arena | 5100 | 25.4% |
| 11/21/2016 | Sun Belt | UT-Arlington | 88 | St Francis (IL) | 67 | 1301 | College Park Center | 7000 | 18.6% |
| 11/18/2016 | MAC | Miami (OH) | 66 | Delaware | 68 | 1317 | Millett Hall | 6400 | 20.6% |
| 11/11/2016 | Atlantic 10 | Duquesne | 65 | Loyola (MD) | 60 | 1319 | A.J. Palumbo Center | 4406 | 29.9% |
| 11/11/2016 | West Coast | Pepperdine | 77 | Cal Poly | 68 | 1320 | Firestone Fieldhouse | 4500 | 29.3% |
| 11/16/2016 | Ivy League | Cornell | 63 | Colgate | 67 | 1328 | Newman Arena | 4473 | 29.7% |
| 11/19/2016 | West Coast | Santa Clara | 88 | N Colorado | 72 | 1331 | Leavey Center | 5000 | 26.6% |
| 11/12/2016 | Big South | High Point | 74 | Averett | 41 | 1333 | Millis Athletic Center | 1750 | 76.2% |
| 11/19/2016 | Big West | Cal Poly | 69 | Bethesda | 52 | 1342 | Mott Athletics Center | 3032 | 44.3% |
| 11/21/2016 | MEAC | Savannah State | 118 | Fort Valley St | 101 | 1344 | Tiger Arena | 6000 | 22.4% |
| 11/11/2016 | Conference USA | North Texas | 85 | Sul Ross | 77 | 1347 | UNT Coliseum | 10040 | 13.4% |
| 11/14/2016 | Atlantic 10 | Fordham | 101 | NYIT | 75 | 1351 | Rose Hill Gymnasium | 3470 | 38.9% |
| 11/13/2016 | MEAC | MD-E Shore | 73 | UMBC | 77 | 1364 | Hytche Arena | 5500 | 24.8% |
| 11/20/2016 | Patriot League | Lehigh | 76 | Princeton | 67 | 1388 | Stabler Arena | 6000 | 23.1% |
| 11/17/2016 | Ohio Valley | Tenn Tech | 95 | Alabama A&M | 61 | 1396 | Hooper Eblen Center | 9282 | 15.0% |
| 11/14/2016 | Atlantic Sun | Kennesaw St | 80 | Brewton Parker | 74 | 1402 | KSU Convocation Center | 4792 | 29.3% |
| 11/21/2016 | Conference USA | Rice | 83 | Montana State | 78 | 1408 | Tudor Fieldhouse | 5750 | 24.5% |
| 11/11/2016 | Big Sky | E Washington | 70 | Linfield | 47 | 1410 | Reese Court | 6000 | 23.5% |
| 11/17/2016 | Ivy League | Harvard | 78 | Fisher College | 51 | 1429 | Lavietes Pavilion | 2195 | 65.1% |
| 11/16/2016 | MAC | N Illinois | 63 | Idaho | 49 | 1430 | NIU Convocation Center | 10000 | 14.3% |
| 11/11/2016 | Atlantic Sun | Lipscomb | 96 | Sewanee | 53 | 1446 | Allen Arena | 5028 | 28.8% |
| 11/17/2016 | Summit League | South Dakota | 80 | Doane | 46 | 1456 | The DakotaDome | 10000 | 14.6% |
| 11/11/2016 | MEAC | Delaware State | 103 | Summit | 56 | 1467 | Memorial Hall (Dover, DE) | 3000 | 48.9% |
| 11/11/2016 | Southland | Texas A&M-CC | 115 | Lady of the Lake | 100 | 1473 | American Bank Center | 10000 | 14.7% |
| 11/19/2016 | Atlantic Sun | Lipscomb | 72 | Fair Dickinson | 90 | 1473 | Rose Hill Gymnasium | 3470 | 42.4% |
| 11/14/2016 | Colonial Athletic | Elon | 95 | Charlotte | 100 | 1478 | Alumni Gym (Elon University) | 1585 | 93.2% |
| 11/12/2016 | Mountain West | San Jose State | 109 | West Coast | 70 | 1481 | Event Center (San Jose St.) | 5000 | 29.6% |
| 11/17/2016 | Mountain West | San Jose State | 69 | Denver | 74 | 1481 | Event Center (San Jose St.) | 5000 | 29.6% |
| 11/16/2016 | Summit League | South Dakota | 99 | Presentation College | 60 | 1485 | The DakotaDome | 10000 | 14.9% |
| 11/16/2016 | Southern | W Carolina | 59 | NC Central | 67 | 1495 | Ramsey Center | 7826 | 19.1% |
| 11/20/2016 | MAC | Bowling Green | 61 | Green Bay | 77 | 1514 | Stroh Center | 4700 | 32.2% |
| 11/12/2016 | MAAC | Quinnipiac | 70 | Vermont | 94 | 1517 | TD Bank Sports Center | 3570 | 42.5% |
| 11/18/2016 | Ohio Valley | UT Martin | 85 | Cleveland State | 74 | 1520 | Skyhawk Arena | 5000 | 30.4% |
| 11/18/2016 | MAAC | St Peter’s | 90 | Lipscomb | 77 | 1533 | Rose Hill Gymnasium | 3470 | 44.2% |
| 11/15/2016 | Western Athletic | UMKC | 68 | Drake | 62 | 1535 | Municipal Auditorium (MO) | 7300 | 21.0% |
| 11/17/2016 | Patriot League | Lafayette | 84 | NJIT | 83 | 1539 | Kirby Sports Center | 4000 | 38.5% |
| 11/16/2016 | Big South | Radford | 91 | Central Penn | 69 | 1540 | Donald N. Dedmon Center | 3205 | 48.0% |
| 11/21/2016 | MAC | Bowling Green | 78 | Murray State | 77 | 1545 | Stroh Center | 4700 | 32.9% |
| 11/14/2016 | Ohio Valley | Tenn Tech | 74 | Cent Michigan | 86 | 1546 | Hooper Eblen Center | 9282 | 16.7% |
| 11/16/2016 | Big West | UCSB | 63 | San Francisco | 75 | 1563 | The Thunderdome | 6512 | 24.0% |
| 11/11/2016 | MAC | N Illinois | 80 | Indiana State | 78 | 1565 | NIU Convocation Center | 10000 | 15.7% |
| 11/12/2016 | Western Athletic | CSU Bakersfield | 96 | SD Christian | 54 | 1566 | Icardo Center | 3800 | 41.2% |
| 11/20/2016 | Big Sky | North Dakota | 101 | Presentation College | 63 | 1573 | Betty Engelstad Sioux Center | 3300 | 47.7% |
| 11/14/2016 | Ohio Valley | Austin Peay | 107 | Oakland City | 67 | 1592 | Dave Aaron Arena | 9000 | 17.7% |
| 11/16/2016 | America East | Binghamton | 72 | Cent Conn St | 70 | 1601 | Events Center (Binghamton) | 5142 | 31.1% |
| 11/17/2016 | Sun Belt | LA-Lafayette | 117 | Panhandle St | 47 | 1607 | Cajundome | 13500 | 11.9% |
| 11/15/2016 | Mountain West | San Jose State | 66 | Portland | 79 | 1623 | Event Center (San Jose St.) | 5000 | 32.5% |
| 11/14/2016 | Sun Belt | Ga Southern | 92 | Coastal Georgia | 43 | 1628 | W. S. Hanner Fieldhouse | 4325 | 37.6% |
| 11/19/2016 | Northeast | Wagner | 64 | Fairfield | 70 | 1635 | Spiro Sports Center | 2100 | 77.9% |
| 11/19/2016 | Summit League | Fort Wayne | 94 | UMass Lowell | 81 | 1667 | Allen County War Memorial Coliseum | 13000 | 12.8% |
| 11/19/2016 | Ohio Valley | Murray State | 93 | Green Bay | 77 | 1676 | Stroh Center | 4700 | 35.7% |
| 11/19/2016 | Big West | UC Irvine | 72 | Pacific | 65 | 1678 | Bren Events Center | 4984 | 33.7% |
| 11/15/2016 | Big Sky | North Dakota | 94 | Mayville St | 66 | 1681 | Betty Engelstad Sioux Center | 3300 | 50.9% |
| 11/11/2016 | Colonial Athletic | Hofstra | 74 | Coppin State | 72 | 1684 | Mack Sports Complex | 5124 | 32.9% |
| 11/14/2016 | Southern | UNCG | 61 | Presbyterian | 42 | 1689 | Greensboro Coliseum | 21273 | 7.9% |
| 11/11/2016 | Colonial Athletic | Georgia State | 111 | Thomas (GA) | 69 | 1690 | GSU Sports Arena | 4500 | 37.6% |
| 11/11/2016 | Northeast | Robert Morris | 50 | Penn | 67 | 1691 | Charles L. Sewall Center | 3056 | 55.3% |
| 11/18/2016 | Southland | Northwestern St | 92 | LeTourneau | 87 | 1701 | Prather Coliseum | 3900 | 43.6% |
| 11/12/2016 | Big West | UCSB | 60 | Omaha | 74 | 1708 | The Thunderdome | 6512 | 26.2% |
| 11/19/2016 | Horizon League | UIC | 102 | Trinity (IL) | 66 | 1713 | UIC Pavilion | 6958 | 24.6% |
| 11/14/2016 | West Coast | Pacific | 76 | Green Bay | 58 | 1716 | Alex G. Spanos Center | 6150 | 27.9% |
| 11/13/2016 | Summit League | North Dakota St | 92 | Minnesota-Morris | 62 | 1723 | Scheels Arena | 6000 | 28.7% |
| 11/12/2016 | West Coast | Santa Clara | 58 | UC Davis | 63 | 1734 | Leavey Center | 5000 | 34.7% |
| 11/12/2016 | Big Sky | N Arizona | 65 | Tennessee St | 69 | 1734 | Leavey Center | 5000 | 34.7% |
| 11/16/2016 | Summit League | South Dakota St | 80 | Wayne St (NE) | 72 | 1749 | Frost Arena | 6500 | 26.9% |
| 11/11/2016 | Southland | Abil Christian | 73 | Schreiner | 59 | 1750 | Moody Coliseum (Abilene) | 4600 | 38.0% |
| 11/18/2016 | Patriot League | Navy | 59 | North Dakota St | 66 | 1750 | Millis Athletic Center | 1750 | 100.0% |
| 11/18/2016 | Big South | High Point | 63 | UNCG | 57 | 1750 | Millis Athletic Center | 1750 | 100.0% |
| 11/19/2016 | Big South | High Point | 69 | Navy | 62 | 1750 | Millis Athletic Center | 1750 | 100.0% |
| 11/16/2016 | Big South | Coast Carolina | 89 | Coppin State | 59 | 1754 | The HTC Center | 3212 | 54.6% |
| 11/13/2016 | Southern | W Carolina | 87 | Hiwassee College | 47 | 1774 | Ramsey Center | 7826 | 22.7% |
| 11/14/2016 | Sun Belt | Little Rock | 100 | Ozarks AR | 61 | 1781 | Jack Stephens Center | 5600 | 31.8% |
| 11/13/2016 | Ohio Valley | Morehead State | 89 | Lipscomb | 75 | 1783 | Ellis T. Johnson Arena | 6500 | 27.4% |
| 11/14/2016 | Atlantic Sun | North Florida | 109 | Edward Waters | 73 | 1787 | UNF Arena | 5800 | 30.8% |
| 11/11/2016 | Missouri Valley | Loyola (CHI) | 69 | Alcorn State | 44 | 1801 | Joseph J. Gentile Center | 4486 | 40.1% |
| 11/19/2016 | Summit League | Omaha | 87 | Rice | 100 | 1814 | Baxter Arena | 7500 | 24.2% |
| 11/11/2016 | West Coast | Santa Clara | 67 | N Arizona | 64 | 1821 | Leavey Center | 5000 | 36.4% |
| 11/20/2016 | Patriot League | Lafayette | 75 | Cornell | 82 | 1821 | Kirby Sports Center | 4000 | 45.5% |
| 11/21/2016 | Sun Belt | LA-Lafayette | 83 | Delaware State | 82 | 1822 | Cajundome | 13500 | 13.5% |
| 11/20/2016 | Sun Belt | South Alabama | 71 | Jacksonville | 58 | 1823 | Mitchell Center | 10041 | 18.2% |
| 11/19/2016 | Pac 12 | Washington St | 87 | Montana | 63 | 1831 | Sports and Fitness Center | 3500 | 52.3% |
| 11/14/2016 | Ohio Valley | E Kentucky | 69 | UNC Wilmington | 78 | 1850 | McBrayer Arena | 6500 | 28.5% |
| 11/11/2016 | Big East | Seton Hall | 91 | Fair Dickinson | 70 | 1856 | Walsh Gymnasium | 2600 | 71.4% |
| 11/11/2016 | Horizon League | Milwaukee | 88 | MSOE | 58 | 1856 | UW-Milwaukee Panther Arena | 12700 | 14.6% |
| 11/21/2016 | Big South | Campbell | 53 | Samford | 66 | 1863 | Pope Convocation Center | 3095 | 60.2% |
| 11/11/2016 | Horizon League | N Kentucky | 96 | Earlham | 56 | 1868 | The Bank of Kentucky Center | 9400 | 19.9% |
| 11/14/2016 | Sun Belt | South Alabama | 88 | Blue Mountain | 35 | 1874 | Mitchell Center | 10041 | 18.7% |
| 11/11/2016 | Big West | UC Irvine | 56 | Utah State | 72 | 1883 | Bren Events Center | 4984 | 37.8% |
| 11/15/2016 | Atlantic 10 | La Salle | 74 | Delaware | 68 | 1888 | Tom Gola Arena | 4000 | 47.2% |
| 11/19/2016 | Western Athletic | CSU Bakersfield | 77 | UCSB | 70 | 1897 | Icardo Center | 3800 | 49.9% |
| 11/11/2016 | Southland | Lamar | 90 | Howard Payne | 47 | 1905 | Montagne Center | 10080 | 18.9% |
| 11/15/2016 | Pac 12 | Washington St | 81 | CWash | 76 | 1935 | Toyota Center WA | 6000 | 32.3% |
| 11/19/2016 | Sun Belt | South Alabama | 84 | Youngstown St | 75 | 1948 | Mitchell Center | 10041 | 19.4% |
| 11/19/2016 | America East | Vermont | 79 | Lyndon State College | 20 | 1955 | Patrick Gymnasium | 3228 | 60.6% |
| 11/14/2016 | Horizon League | Valparaiso | 78 | Coppin State | 58 | 1972 | Athletics-Recreation Center | 5000 | 39.4% |
| 11/18/2016 | MEAC | NC Central | 84 | Jackson State | 75 | 1979 | McDougald-McLendon Gymnasium | 3056 | 64.8% |
| 11/18/2016 | Horizon League | Oakland | 102 | Goshen | 59 | 2001 | Athletics Center O’rena | 4005 | 50.0% |
| 11/16/2016 | Western Athletic | UT Rio Grande | 72 | Texas A&M-CC | 94 | 2002 | UTRGV Fieldhouse | 2500 | 80.1% |
| 11/17/2016 | Atlantic 10 | G Washington | 61 | AR-Pine Bluff | 41 | 2013 | Charles E. Smith Center | 4338 | 46.4% |
| 11/11/2016 | MAAC | Niagara | 66 | Buffalo | 76 | 2016 | Gallagher Center | 2400 | 84.0% |
| 11/20/2016 | Missouri Valley | Northern Iowa | 59 | Xavier | 67 | 2016 | HP Field House | 5000 | 40.3% |
| 11/18/2016 | Colonial Athletic | Drexel | 87 | Hartford | 73 | 2025 | Daskalakis Athletic Center | 2532 | 80.0% |
| 11/12/2016 | Summit League | Denver | 84 | Jacksonville | 92 | 2030 | Magness Arena | 7200 | 28.2% |
| 11/18/2016 | West Coast | Portland | 98 | Lewis & Clark | 52 | 2034 | Chiles Center | 4852 | 41.9% |
| 11/15/2016 | ACC | Boston College | 73 | MD-E Shore | 57 | 2051 | Silvio Conte Forum | 8606 | 23.8% |
| 11/18/2016 | MAC | Kent State | 111 | Hiram | 55 | 2057 | MAC Center | 6327 | 32.5% |
| 11/11/2016 | MAC | W Michigan | 90 | Marygrove | 74 | 2058 | University Arena (MI) | 5421 | 38.0% |
| 11/16/2016 | Conference USA | Rice | 68 | Texas Southern | 71 | 2082 | Tudor Fieldhouse | 5750 | 36.2% |
| 11/17/2016 | MAC | Cent Michigan | 107 | Marygrove | 58 | 2096 | McGuirk Arena | 5300 | 39.5% |
| 11/21/2016 | SEC | Alabama | 60 | Valparaiso | 68 | 2107 | MGM Grand Garden Arena | 16800 | 12.5% |
| 11/20/2016 | ACC | Boston College | 82 | Stony Brook | 75 | 2108 | Silvio Conte Forum | 8606 | 24.5% |
| 11/15/2016 | MAC | E Michigan | 78 | Rochester (MI) | 63 | 2109 | Convocation Center (MI) | 8824 | 23.9% |
| 11/17/2016 | Big West | UC Davis | 89 | Holy Names | 75 | 2113 | The Pavilion (UC Davis) | 7926 | 26.7% |
| 11/19/2016 | Big West | UC Riverside | 96 | Fresno Pacific | 50 | 2115 | SRC Arena | 3168 | 66.8% |
| 11/11/2016 | West Coast | Loyola Mary | 99 | Vanguard | 51 | 2118 | Gersten Pavilion | 4156 | 51.0% |
| 11/11/2016 | MEAC | Hampton | 56 | Rider | 67 | 2152 | Convocation Center (VA) | 7200 | 29.9% |
| 11/11/2016 | West Coast | San Francisco | 82 | UIC | 80 | 2193 | War Memorial Gymnasium | 5300 | 41.4% |
| 11/21/2016 | Conference USA | Southern Miss | 63 | Alabama A&M | 55 | 2202 | Reed Green Coliseum | 8095 | 27.2% |
| 11/16/2016 | Patriot League | Bucknell | 75 | Robert Morris | 62 | 2205 | Sojka Pavilion | 4000 | 55.1% |
| 11/17/2016 | Big East | USF | 61 | Elon | 74 | 2206 | USF Sun Dome | 10411 | 21.2% |
| 11/15/2016 | Atlantic 10 | G Washington | 77 | Siena | 75 | 2224 | Charles E. Smith Center | 4338 | 51.3% |
| 11/16/2016 | Mountain West | Colorado State | 84 | Ft Lewis | 75 | 2253 | Moby Arena | 8745 | 25.8% |
| 11/18/2016 | Sun Belt | South Alabama | 69 | FIU | 64 | 2255 | Mitchell Center | 10041 | 22.5% |
| 11/16/2016 | Big Sky | Montana State | 93 | Rocky Mo | 76 | 2262 | Brick Breeden Fieldhouse | 7250 | 31.2% |
| 11/13/2016 | Mountain West | Colorado State | 64 | New Mexico St | 61 | 2264 | Moby Arena | 8745 | 25.9% |
| 11/11/2016 | Colonial Athletic | Delaware | 64 | Goldey-Beacom | 56 | 2277 | Bob Carpenter Center | 5000 | 45.5% |
| 11/11/2016 | Colonial Athletic | Northeastern | 87 | Boston U | 77 | 2287 | Matthews Arena | 6000 | 38.1% |
| 11/11/2016 | Ohio Valley | E Kentucky | 97 | IUPUI | 87 | 2300 | McBrayer Arena | 6500 | 35.4% |
| 11/19/2016 | Horizon League | Oakland | 107 | Chicago State | 79 | 2301 | Athletics Center O’rena | 4005 | 57.5% |
| 11/21/2016 | Colonial Athletic | JMU | 56 | Texas Southern | 67 | 2311 | JMU Convocation Center | 7156 | 32.3% |
| 11/19/2016 | Colonial Athletic | William & Mary | 89 | Presbyterian | 59 | 2315 | Kaplan Arena | 8600 | 26.9% |
| 11/11/2016 | Northeast | Cent Conn St | 75 | Hartford | 60 | 2317 | William H. Detrick Gymnasium | 2654 | 87.3% |
| 11/14/2016 | Big South | Coast Carolina | 64 | Charleston | 71 | 2325 | The HTC Center | 3212 | 72.4% |
| 11/13/2016 | Big East | DePaul | 78 | Robert Morris | 72 | 2330 | Allstate Arena | 17500 | 13.3% |
| 11/14/2016 | Horizon League | Oakland | 77 | W Michigan | 60 | 2335 | Athletics Center O’rena | 4005 | 58.3% |
| 11/12/2016 | Sun Belt | Little Rock | 97 | Central Baptist | 65 | 2363 | Jack Stephens Center | 5600 | 42.2% |
| 11/14/2016 | West Coast | San Diego | 65 | Samford | 83 | 2379 | Jenny Craig Pavilion | 5100 | 46.6% |
| 11/14/2016 | Big Sky | Montana State | 84 | LA-Lafayette | 83 | 2395 | Brick Breeden Fieldhouse | 7250 | 33.0% |
| 11/21/2016 | Big Ten | Wisconsin | 74 | Tennessee | 62 | 2400 | Lahaina Civic Center | 2400 | 100.0% |
| 11/21/2016 | Pac 12 | Oregon | 61 | Georgetown | 65 | 2400 | Lahaina Civic Center | 2400 | 100.0% |
| 11/21/2016 | ACC | UConn | 90 | Oklahoma State | 98 | 2400 | Lahaina Civic Center | 2400 | 100.0% |
| 11/21/2016 | Pacific West | Chaminade | 61 | UNC | 104 | 2400 | Lahaina Civic Center | 2400 | 100.0% |
| 11/12/2016 | Colonial Athletic | William & Mary | 96 | Bridgewater | 44 | 2404 | Kaplan Arena | 8600 | 28.0% |
| 11/11/2016 | Missouri Valley | Drake | 74 | South Dakota | 79 | 2439 | The Knapp Center | 7152 | 34.1% |
| 11/11/2016 | MAC | Cent Michigan | 117 | IU-Kokomo | 53 | 2498 | McGuirk Arena | 5300 | 47.1% |
| 11/12/2016 | Big South | Winthrop | 66 | Ferrum | 47 | 2501 | Winthrop Coliseum | 6100 | 41.0% |
| 11/18/2016 | Conference USA | Southern Miss | 60 | Union (TN) | 44 | 2513 | Reed Green Coliseum | 8095 | 31.0% |
| 11/15/2016 | MEAC | Norfolk State | 91 | ElizCity | 55 | 2519 | Echols Hall | 7000 | 36.0% |
| 11/16/2016 | MAC | Kent State | 93 | Miss Valley St | 63 | 2524 | MAC Center | 6327 | 39.9% |
| 11/18/2016 | Big Sky | Montana State | 80 | JMU | 73 | 2539 | Brick Breeden Fieldhouse | 7250 | 35.0% |
| 11/19/2016 | Missouri Valley | Drake | 76 | Simpson | 61 | 2541 | The Knapp Center | 7152 | 35.5% |
| 11/11/2016 | Conference USA | Southern Miss | 101 | Tougaloo | 96 | 2569 | Reed Green Coliseum | 8095 | 31.7% |
| 11/12/2016 | Horizon League | Valparaiso | 89 | Trinity (IL) | 75 | 2588 | Athletics-Recreation Center | 5000 | 51.8% |
| 11/11/2016 | West Coast | Portland | 71 | UC Riverside | 55 | 2601 | Chiles Center | 4852 | 53.6% |
| 11/12/2016 | Horizon League | Youngstown St | 90 | Akron | 82 | 2601 | Beeghly Center | 6500 | 40.0% |
| 11/14/2016 | America East | Hartford | 82 | Niagara | 78 | 2607 | Chase Arena | 4107 | 63.5% |
| 11/19/2016 | Atlantic 10 | La Salle | 76 | Texas Southern | 77 | 2622 | Tom Gola Arena | 4000 | 65.6% |
| 11/15/2016 | Atlantic 10 | George Mason | 90 | Lebanon Valley | 65 | 2638 | EagleBank Arena | 10000 | 26.4% |
| 11/19/2016 | Big East | USF | 70 | Rider | 65 | 2639 | USF Sun Dome | 10411 | 25.3% |
| 11/14/2016 | Summit League | Oral Roberts | 87 | Rogers State | 76 | 2653 | Mabee Center | 11300 | 23.5% |
| 11/16/2016 | West Coast | Saint Mary’s | 110 | PV A&M | 72 | 2673 | McKeon Pavilion | 3500 | 76.4% |
| 11/21/2016 | Big East | Creighton | 86 | Ole Miss | 77 | 2699 | Sports and Fitness Center | 3500 | 77.1% |
| 11/20/2016 | Big East | Creighton | 112 | NC State | 94 | 2755 | Sports and Fitness Center | 3500 | 78.7% |
| 11/11/2016 | Patriot League | Bucknell | 76 | Manhattan | 64 | 2763 | Sojka Pavilion | 4000 | 69.1% |
| 11/17/2016 | MAC | Akron | 72 | American U | 62 | 2785 | James A. Rhodes Arena | 5500 | 50.6% |
| 11/15/2016 | Pac 12 | Stanford | 96 | CS Northridge | 69 | 2801 | Maples Pavilion | 7329 | 38.2% |
| 11/11/2016 | Ohio Valley | Morehead State | 106 | KY Christian | 41 | 2865 | Ellis T. Johnson Arena | 6500 | 44.1% |
| 11/17/2016 | Conference USA | UTEP | 81 | Wake Forest | 103 | 2925 | TD Arena | 5100 | 57.4% |
| 11/12/2016 | Mountain West | Boise State | 85 | Northwest (WA) | 46 | 2989 | Taco Bell Arena | 12480 | 24.0% |
| 11/13/2016 | Pac 12 | USC | 82 | Omaha | 72 | 2993 | Galen Center | 10258 | 29.2% |
| 11/11/2016 | The American | Houston | 93 | Morgan State | 52 | 3005 | Hofheinz Pavilion | 10000 | 30.1% |
| 11/16/2016 | Conference USA | LA Tech | 87 | Alabama State | 56 | 3016 | Thomas Assembly Center | 8098 | 37.2% |
| 11/13/2016 | Summit League | South Dakota | 78 | Bowling Green | 72 | 3017 | The DakotaDome | 10000 | 30.2% |
| 11/18/2016 | Ohio Valley | SIU ED | 83 | S Illinois | 101 | 3017 | Vadalabene Center | 4157 | 72.6% |
| 11/13/2016 | MEAC | Norfolk State | 78 | Shenandoah | 58 | 3018 | Echols Hall | 7000 | 43.1% |
| 11/14/2016 | Southern | ETSU | 107 | Detroit | 78 | 3026 | Freedom Hall Civic Center | 5619 | 53.9% |
| 11/11/2016 | MAAC | Fairfield | 85 | Sacred Heart | 63 | 3043 | Webster Bank Arena | 10000 | 30.4% |
| 11/15/2016 | MEAC | Morgan State | 72 | Towson | 78 | 3047 | Hill Field House | 4250 | 71.7% |
| 11/21/2016 | Horizon League | Wright State | 109 | Ohio Dominican | 54 | 3105 | Nutter Center | 10400 | 29.9% |
| 11/11/2016 | Big East | USF | 84 | Florida A&M | 73 | 3106 | USF Sun Dome | 10411 | 29.8% |
| 11/21/2016 | Ohio Valley | E Illinois | 71 | Troy | 67 | 3111 | Lantz Arena | 5300 | 58.7% |
| 11/17/2016 | Missouri Valley | Missouri State | 100 | Fontbonne College | 27 | 3121 | JQH Arena | 11000 | 28.4% |
| 11/11/2016 | ACC | Boston College | 73 | Nicholls | 79 | 3122 | Silvio Conte Forum | 8606 | 36.3% |
| 11/11/2016 | Big West | LBSU | 95 | Cal State-LA | 59 | 3125 | Walter Pyramid | 5000 | 62.5% |
| 11/17/2016 | MEAC | Hampton | 70 | Chowan | 69 | 3126 | Convocation Center (VA) | 7200 | 43.4% |
| 11/19/2016 | Missouri Valley | Indiana State | 96 | MO-St. Louis | 55 | 3141 | Hulman Center | 10200 | 30.8% |
| 11/16/2016 | Atlantic Sun | North Florida | 56 | Miami | 94 | 3148 | UNF Arena | 5800 | 54.3% |
| 11/16/2016 | Southern | Chattanooga | 102 | Hiwassee College | 54 | 3150 | McKenzie Arena | 10928 | 28.8% |
| 11/17/2016 | MAC | Buffalo | 85 | Nazareth | 38 | 3152 | Alumni Arena | 6100 | 51.7% |
| 11/16/2016 | America East | Albany | 97 | SUNY Oneonta | 56 | 3163 | SEFCU Arena | 4538 | 69.7% |
| 11/11/2016 | Horizon League | Oakland | 78 | Bowling Green | 70 | 3250 | Athletics Center O’rena | 4005 | 81.1% |
| 11/11/2016 | Atlantic 10 | G Washington | 75 | MD-E Shore | 71 | 3256 | Charles E. Smith Center | 4338 | 75.1% |
| 11/19/2016 | The American | Tulsa | 77 | New Orleans | 68 | 3271 | Reynolds Center | 8355 | 39.2% |
| 11/11/2016 | America East | Binghamton | 68 | Cornell | 62 | 3278 | Events Center (Binghamton) | 5142 | 63.7% |
| 11/15/2016 | Big South | Liberty | 59 | VCU | 64 | 3289 | Vines Center | 8085 | 40.7% |
| 11/11/2016 | Southern | ETSU | 96 | Fordham | 59 | 3309 | Freedom Hall Civic Center | 5619 | 58.9% |
| 11/14/2016 | Big Sky | Montana | 72 | Wyoming | 73 | 3318 | Dahlberg Arena | 7321 | 45.3% |
| 11/19/2016 | Ohio Valley | Belmont | 90 | W Kentucky | 69 | 3319 | Curb Event Center | 5085 | 65.3% |
| 11/13/2016 | Missouri Valley | Missouri State | 91 | Jacksonville St | 65 | 3330 | JQH Arena | 11000 | 30.3% |
| 11/16/2016 | Western Athletic | New Mexico St | 58 | Samford | 48 | 3373 | Pan American Center | 13071 | 25.8% |
| 11/11/2016 | America East | Stony Brook | 66 | Columbia | 73 | 3385 | Island FCU Arena | 4000 | 84.6% |
| 11/20/2016 | The American | ECU | 73 | Stetson | 50 | 3387 | Minges Coliseum | 8000 | 42.3% |
| 11/17/2016 | West Coast | Loyola Mary | 62 | UConn | 65 | 3421 | Gersten Pavilion | 4156 | 82.3% |
| 11/17/2016 | Colonial Athletic | Charleston | 60 | Boise State | 47 | 3430 | TD Arena | 5100 | 67.3% |
| 11/18/2016 | Atlantic 10 | George Mason | 76 | Mt St Mary’s | 78 | 3487 | EagleBank Arena | 10000 | 34.9% |
| 11/11/2016 | West Coast | Saint Mary’s | 81 | Nevada | 63 | 3500 | McKeon Pavilion | 3500 | 100.0% |
| 11/11/2016 | Missouri Valley | Missouri State | 96 | Alabama A&M | 62 | 3502 | JQH Arena | 11000 | 31.8% |
| 11/20/2016 | Southern | Mercer | 80 | Ga Southern | 67 | 3508 | Hawkins Arena | 3500 | 100.2% |
| 11/11/2016 | Pac 12 | USC | 75 | Montana | 61 | 3513 | Galen Center | 10258 | 34.2% |
| 11/18/2016 | Colonial Athletic | Charleston | 40 | UCF | 60 | 3517 | TD Arena | 5100 | 69.0% |
| 11/21/2016 | SEC | Georgia | 81 | G Washington | 73 | 3527 | Sprint Center | 18972 | 18.6% |
| 11/14/2016 | Atlantic 10 | Saint Joe’s | 85 | Columbia | 65 | 3543 | Hagan Arena | 4200 | 84.4% |
| 11/11/2016 | Southern | Mercer | 87 | Brewton Parker | 53 | 3553 | Hawkins Arena | 3500 | 101.5% |
| 11/11/2016 | Horizon League | Valparaiso | 79 | Southern Utah | 65 | 3560 | Athletics-Recreation Center | 5000 | 71.2% |
| 11/16/2016 | Horizon League | UIC | 86 | UTSA | 78 | 3571 | UIC Pavilion | 6958 | 51.3% |
| 11/20/2016 | Big Ten | Rutgers | 78 | Niagara | 65 | 3572 | Louis Brown Athletic Center | 8000 | 44.7% |
| 11/20/2016 | Patriot League | Holy Cross | 60 | UMass | 68 | 3591 | Hart Center | 3600 | 99.8% |
| 11/11/2016 | The American | Tulsa | 73 | Jacksonville St | 84 | 3604 | Reynolds Center | 8355 | 43.1% |
| 11/14/2016 | Missouri Valley | Evansville | 82 | Alcorn State | 59 | 3669 | Ford Center | 19164 | 19.1% |
| 11/14/2016 | Conference USA | UAB | 74 | Furman | 84 | 3682 | Bartow Arena | 8508 | 43.3% |
| 11/13/2016 | SEC | Florida | 76 | Mercer | 54 | 3716 | Veterans Memorial Arena | 14091 | 26.4% |
| 11/17/2016 | Atlantic 10 | UMass | 70 | Temple | 67 | 3732 | William D. Mullins Memorial Center | 9493 | 39.3% |
| 11/11/2016 | MAAC | Monmouth | 78 | Drexel | 65 | 3738 | OceanFirst Bank Center | 4100 | 91.2% |
| 11/11/2016 | Big Ten | Rutgers | 86 | Molloy | 57 | 3755 | Louis Brown Athletic Center | 8000 | 46.9% |
| 11/15/2016 | Horizon League | Wright State | 89 | Miami (OH) | 87 | 3813 | Nutter Center | 10400 | 36.7% |
| 11/19/2016 | Missouri Valley | Evansville | 69 | Morehead State | 56 | 3836 | Ford Center | 19164 | 20.0% |
| 11/15/2016 | MAC | Ball State | 74 | Indiana State | 80 | 3845 | Worthen Arena | 11500 | 33.4% |
| 11/15/2016 | MAC | Toledo | 103 | Youngstown St | 98 | 3891 | Savage Arena | 9000 | 43.2% |
| 11/21/2016 | Missouri Valley | S Illinois | 73 | Mt St Mary’s | 63 | 3971 | SIU Arena | 8339 | 47.6% |
| 11/13/2016 | SEC | Missouri | 99 | Alabama A&M | 44 | 3977 | Mizzou Arena | 15061 | 26.4% |
| 11/18/2016 | ACC | Wake Forest | 77 | Villanova | 96 | 4020 | TD Arena | 5100 | 78.8% |
| 11/18/2016 | Conference USA | UTEP | 85 | W Michigan | 75 | 4020 | TD Arena | 5100 | 78.8% |
| 11/11/2016 | SWAC | Jackson State | 66 | Xavier LA | 54 | 4021 | Lee E. Williams Athletic and Assembly Center | 8000 | 50.3% |
| 11/14/2016 | Atlantic 10 | URI | 107 | Marist | 65 | 4021 | Ryan Center | 7657 | 52.5% |
| 11/20/2016 | Colonial Athletic | UNC Wilmington | 68 | ETSU | 59 | 4032 | Trask Coliseum | 6100 | 66.1% |
| 11/16/2016 | Missouri Valley | S Illinois | 85 | Missouri South St | 64 | 4042 | SIU Arena | 8339 | 48.5% |
| 11/12/2016 | Missouri Valley | Northern Iowa | 74 | Coe College | 37 | 4053 | McLeod Center | 6650 | 60.9% |
| 11/13/2016 | Big Ten | Rutgers | 87 | Drexel | 66 | 4056 | Louis Brown Athletic Center | 8000 | 50.7% |
| 11/17/2016 | Big East | DePaul | 59 | Rutgers | 66 | 4057 | Allstate Arena | 17500 | 23.2% |
| 11/13/2016 | Pac 12 | Oregon State | 72 | UTSA | 64 | 4070 | Gill Coliseum | 9604 | 42.4% |
| 11/16/2016 | Missouri Valley | Illinois State | 75 | Fort Wayne | 57 | 4081 | Redbird Arena | 10200 | 40.0% |
| 11/18/2016 | Southland | SF Austin | 75 | Northeastern St | 70 | 4103 | William R. Johnson Coliseum | 7203 | 57.0% |
| 11/11/2016 | Big East | Marquette | 95 | Vanderbilt | 71 | 4116 | Alumni Hall | 5710 | 72.1% |
| 11/11/2016 | Patriot League | Navy | 68 | OSU | 78 | 4116 | Alumni Hall | 5710 | 72.1% |
| 11/17/2016 | SEC | Florida | 73 | St Bonaventure | 66 | 4133 | The Lakeland Center | 8178 | 50.5% |
| 11/12/2016 | Conference USA | W Kentucky | 79 | Alabama State | 66 | 4149 | E. A. Diddle Arena | 7326 | 56.6% |
| 11/13/2016 | Pac 12 | Arizona State | 96 | Cal Poly | 74 | 4155 | Wells Fargo Arena (AZ) | 10754 | 38.6% |
| 11/14/2016 | The American | ECU | 61 | NC A&T | 51 | 4177 | Minges Coliseum | 8000 | 52.2% |
| 11/11/2016 | Colonial Athletic | Charleston | 81 | The Citadel | 68 | 4178 | TD Arena | 5100 | 81.9% |
| 11/16/2016 | Pac 12 | Oregon State | 60 | Lamar | 63 | 4182 | Gill Coliseum | 9604 | 43.5% |
| 11/12/2016 | Atlantic 10 | Saint Joe’s | 77 | Toledo | 76 | 4200 | Hagan Arena | 4200 | 100.0% |
| 11/21/2016 | Big East | Providence | 64 | St Francis (BKN) | 48 | 4208 | Dunkin Donuts Center | 12400 | 33.9% |
| 11/16/2016 | Conference USA | W Kentucky | 74 | Jacksonville St | 67 | 4226 | E. A. Diddle Arena | 7326 | 57.7% |
| 11/11/2016 | Colonial Athletic | UNC Wilmington | 110 | Claflin | 64 | 4246 | Trask Coliseum | 6100 | 69.6% |
| 11/17/2016 | Conference USA | Charlotte | 76 | ECU | 64 | 4281 | Halton Arena | 9105 | 47.0% |
| 11/11/2016 | Conference USA | UAB | 86 | AR-Pine Bluff | 66 | 4289 | Bartow Arena | 8508 | 50.4% |
| 11/11/2016 | Ohio Valley | Murray State | 73 | Illinois State | 70 | 4321 | CFSB Center | 8602 | 50.2% |
| 11/12/2016 | Atlantic 10 | St Bonaventure | 92 | St Francis (PA) | 82 | 4322 | Reilly Center | 5480 | 78.9% |
| 11/20/2016 | Western Athletic | New Mexico St | 89 | Bethune-Cookman | 73 | 4323 | Pan American Center | 13071 | 33.1% |
| 11/20/2016 | The American | UCF | 57 | Villanova | 67 | 4325 | TD Arena | 5100 | 84.8% |
| 11/14/2016 | ACC | Georgia Tech | 77 | Southern | 62 | 4360 | McCamish Pavilion | 9191 | 47.4% |
| 11/11/2016 | Big East | St John’s | 100 | Bethune-Cookman | 53 | 4371 | Carnesecca Arena | 5602 | 78.0% |
| 11/11/2016 | Missouri Valley | S Illinois | 81 | Wright State | 85 | 4427 | SIU Arena | 8339 | 53.1% |
| 11/11/2016 | SEC | Miss St | 78 | Norfolk State | 74 | 4467 | Humphrey Coliseum | 10575 | 42.2% |
| 11/15/2016 | Conference USA | Mid Tennessee | 87 | Murray State | 81 | 4507 | Murphy Athletic Center | 11807 | 38.2% |
| 11/20/2016 | Big East | DePaul | 77 | Milwaukee | 59 | 4518 | Allstate Arena | 17500 | 25.8% |
| 11/15/2016 | ACC | FSU | 99 | Iona | 78 | 4530 | Donald L. Tucker Center | 12100 | 37.4% |
| 11/12/2016 | Sun Belt | UT-Arlington | 89 | Texas Southern | 82 | 4532 | College Park Center | 7000 | 64.7% |
| 11/12/2016 | Atlantic 10 | Davidson | 86 | Appalachian St | 74 | 4598 | John M. Belk Arena | 5223 | 88.0% |
| 11/14/2016 | ACC | Pitt | 99 | Gardner-Webb | 80 | 4614 | Petersen Events Center | 12508 | 36.9% |
| 11/17/2016 | Conference USA | UAB | 74 | Troy | 51 | 4656 | Bartow Arena | 8508 | 54.7% |
| 11/14/2016 | Atlantic 10 | Saint Louis | 88 | Southern Utah | 76 | 4725 | Chaifetz Arena | 10600 | 44.6% |
| 11/11/2016 | Pac 12 | Oregon State | 78 | PV A&M | 58 | 4765 | Gill Coliseum | 9604 | 49.6% |
| 11/20/2016 | Atlantic 10 | Richmond | 81 | Robert Morris | 69 | 4768 | Robins Center | 9071 | 52.6% |
| 11/21/2016 | Conference USA | Marshall | 71 | Jackson State | 61 | 4785 | Cam Henderson Center | 10705 | 44.7% |
| 11/18/2016 | ACC | Georgia Tech | 61 | Ohio | 67 | 4802 | McCamish Pavilion | 9191 | 52.2% |
| 11/11/2016 | The American | ECU | 72 | Grambling St | 57 | 4805 | Minges Coliseum | 8000 | 60.1% |
| 11/12/2016 | Atlantic 10 | George Mason | 61 | Towson | 67 | 4814 | EagleBank Arena | 10000 | 48.1% |
| 11/19/2016 | Conference USA | Mid Tennessee | 63 | Tennessee St | 74 | 4830 | Murphy Athletic Center | 11807 | 40.9% |
| 11/11/2016 | Conference USA | Charlotte | 101 | Newberry | 88 | 4866 | Halton Arena | 9105 | 53.4% |
| 11/14/2016 | The American | Temple | 52 | UNH | 57 | 4893 | Liacouras Center | 10206 | 47.9% |
| 11/13/2016 | Missouri Valley | Bradley | 49 | Delaware | 63 | 4897 | Carver Arena | 11164 | 43.9% |
| 11/14/2016 | Big 12 | Oklahoma State | 102 | Cent Arkansas | 90 | 4911 | Gallagher-Iba Arena | 13611 | 36.1% |
| 11/17/2016 | Atlantic 10 | Saint Louis | 74 | E Illinois | 69 | 4948 | Chaifetz Arena | 10600 | 46.7% |
| 11/20/2016 | ACC | FSU | 100 | Detroit Mercy | 71 | 4962 | Donald L. Tucker Center | 12100 | 41.0% |
| 11/14/2016 | Big East | St John’s | 77 | Binghamton | 61 | 4969 | Carnesecca Arena | 5602 | 88.7% |
| 11/16/2016 | Big 12 | Oklahoma State | 117 | New Orleans | 72 | 4992 | Gallagher-Iba Arena | 13611 | 36.7% |
| 11/11/2016 | Summit League | North Dakota St | 76 | Arkansas State | 66 | 5005 | Scheels Arena | 6000 | 83.4% |
| 11/11/2016 | Mountain West | Wyoming | 88 | Western St. | 49 | 5008 | Arena-Auditorium | 15028 | 33.3% |
| 11/14/2016 | Atlantic 10 | Richmond | 61 | Old Dominion | 64 | 5028 | Robins Center | 9071 | 55.4% |
| 11/18/2016 | Missouri Valley | Bradley | 84 | SE Missouri St | 78 | 5142 | Carver Arena | 11164 | 46.1% |
| 11/20/2016 | The American | Temple | 88 | Manhattan | 67 | 5156 | Liacouras Center | 10206 | 50.5% |
| 11/11/2016 | Missouri Valley | Bradley | 70 | IL-Springfield | 55 | 5176 | Carver Arena | 11164 | 46.4% |
| 11/18/2016 | ACC | FSU | 100 | Winthrop | 86 | 5197 | Donald L. Tucker Center | 12100 | 43.0% |
| 11/11/2016 | SEC | Florida | 80 | FGCU | 59 | 5212 | Veterans Memorial Arena | 14091 | 37.0% |
| 11/11/2016 | Atlantic 10 | UMass | 90 | UMass Lowell | 76 | 5229 | William D. Mullins Memorial Center | 9493 | 55.1% |
| 11/11/2016 | Big 12 | Baylor | 76 | Oral Roberts | 61 | 5250 | Ferrell Center | 10347 | 50.7% |
| 11/19/2016 | Mountain West | Fresno State | 83 | Lamar | 64 | 5269 | Save Mart Center | 15544 | 33.9% |
| 11/14/2016 | The American | UCF | 80 | Nicholls | 56 | 5274 | CFE Arena | 9465 | 55.7% |
| 11/14/2016 | SEC | Ole Miss | 90 | UMass | 88 | 5291 | The Pavilion at Ole Miss | 9500 | 55.7% |
| 11/13/2016 | Big West | Hawai’i | 74 | Texas State | 68 | 5309 | Stan Sheriff Center | 10300 | 51.5% |
| 11/14/2016 | Big West | Hawai’i | 64 | FAU | 63 | 5334 | Stan Sheriff Center | 10300 | 51.8% |
| 11/12/2016 | Conference USA | Marshall | 81 | NC Central | 69 | 5375 | Cam Henderson Center | 10705 | 50.2% |
| 11/11/2016 | Big West | Hawai’i | 68 | SIU ED | 69 | 5423 | Stan Sheriff Center | 10300 | 52.7% |
| 11/11/2016 | Big South | Liberty | 81 | Cairn University | 53 | 5449 | Vines Center | 8085 | 67.4% |
| 11/11/2016 | Southern | UNCG | 51 | UVA | 76 | 5513 | Greensboro Coliseum | 21273 | 25.9% |
| 11/14/2016 | Big Ten | Northwestern | 86 | E Washington | 72 | 5604 | Welsh-Ryan Arena | 8117 | 69.0% |
| 11/16/2016 | Atlantic 10 | URI | 79 | Brown | 72 | 5630 | Ryan Center | 7657 | 73.5% |
| 11/14/2016 | Big 12 | TCU | 98 | Alabama State | 62 | 5644 | Ed and Rae Schollmaier Arena | 7201 | 78.4% |
| 11/15/2016 | Big Ten | Penn State | 85 | Grand Canyon | 76 | 5678 | Bryce Jordan Center | 15261 | 37.2% |
| 11/19/2016 | Conference USA | Marshall | 98 | W Carolina | 63 | 5741 | Cam Henderson Center | 10705 | 53.6% |
| 11/11/2016 | Western Athletic | New Mexico St | 100 | Arizona Christian | 52 | 5803 | Pan American Center | 13071 | 44.4% |
| 11/18/2016 | Big 12 | TCU | 79 | Jacksonville St | 60 | 5839 | Ed and Rae Schollmaier Arena | 7201 | 81.1% |
| 11/13/2016 | Big Ten | Penn State | 82 | Duquesne | 74 | 5856 | Bryce Jordan Center | 15261 | 38.4% |
| 11/14/2016 | Big East | Cincinnati | 74 | Albany | 51 | 5864 | Fifth Third Arena | 13176 | 44.5% |
| 11/16/2016 | Conference USA | Marshall | 85 | Morehead State | 77 | 5872 | Cam Henderson Center | 10705 | 54.9% |
| 11/15/2016 | Big 12 | Baylor | 66 | Oregon | 49 | 5891 | Ferrell Center | 10347 | 56.9% |
| 11/19/2016 | Big 12 | Texas Tech | 90 | E Kentucky | 71 | 5898 | United Supermarkets Arena | 15020 | 39.3% |
| 11/18/2016 | Big 12 | Baylor | 81 | FGCU | 72 | 5906 | Ferrell Center | 10347 | 57.1% |
| 11/17/2016 | SEC | Georgia | 84 | Furman | 78 | 5923 | Stegeman Coliseum | 11200 | 52.9% |
| 11/21/2016 | Big 12 | TCU | 80 | Illinois State | 71 | 5938 | Ed and Rae Schollmaier Arena | 7201 | 82.5% |
| 11/15/2016 | Southland | SF Austin | 66 | Longwood | 60 | 5944 | William R. Johnson Coliseum | 7203 | 82.5% |
| 11/11/2016 | West Coast | Gonzaga | 92 | Utah Valley | 69 | 6000 | McCarthey Athletic Center | 6000 | 100.0% |
| 11/14/2016 | West Coast | Gonzaga | 69 | San Diego State | 48 | 6000 | McCarthey Athletic Center | 6000 | 100.0% |
| 11/18/2016 | West Coast | Gonzaga | 109 | Bryant | 70 | 6000 | McCarthey Athletic Center | 6000 | 100.0% |
| 11/11/2016 | ACC | Georgia Tech | 70 | Tenn Tech | 55 | 6018 | McCamish Pavilion | 9191 | 65.5% |
| 11/11/2016 | Conference USA | Mid Tennessee | 102 | Milligan | 64 | 6020 | Murphy Athletic Center | 11807 | 51.0% |
| 11/14/2016 | Mountain West | Fresno State | 78 | PV A&M | 84 | 6036 | Save Mart Center | 15544 | 38.8% |
| 11/11/2016 | The American | Tulane | 75 | UNC | 95 | 6043 | Smoothie King Center | 16867 | 35.8% |
| 11/14/2016 | SEC | Texas A&M | 76 | American U | 53 | 6043 | Reed Arena | 12989 | 46.5% |
| 11/11/2016 | Atlantic 10 | URI | 84 | Dartmouth | 61 | 6052 | Ryan Center | 7657 | 79.0% |
| 11/11/2016 | Big Ten | Northwestern | 94 | Miss Valley St | 63 | 6056 | Welsh-Ryan Arena | 8117 | 74.6% |
| 11/15/2016 | Big 12 | Texas Tech | 70 | North Texas | 43 | 6065 | United Supermarkets Arena | 15020 | 40.4% |
| 11/11/2016 | Big 12 | TCU | 82 | St. Thomas (TX) | 64 | 6075 | Ed and Rae Schollmaier Arena | 7201 | 84.4% |
| 11/11/2016 | Mountain West | Fresno State | 69 | UTSA | 66 | 6088 | Save Mart Center | 15544 | 39.2% |
| 11/19/2016 | Big East | Providence | 71 | Grambling St | 54 | 6093 | Dunkin Donuts Center | 12400 | 49.1% |
| 11/16/2016 | Western Athletic | Utah Valley | 82 | Idaho State | 73 | 6117 | UCCU Center | 8500 | 72.0% |
| 11/11/2016 | SEC | Ole Miss | 86 | UT Martin | 83 | 6123 | The Pavilion at Ole Miss | 9500 | 64.5% |
| 11/11/2016 | Big 12 | Oklahoma State | 102 | Campbell | 65 | 6126 | Gallagher-Iba Arena | 13611 | 45.0% |
| 11/11/2016 | Big Sky | Weber State | 128 | Antelope | 65 | 6140 | Dee Events Center | 11500 | 53.4% |
| 11/14/2016 | Mountain West | Nevada | 79 | Loyola Mary | 64 | 6176 | Lawlor Events Center | 11536 | 53.5% |
| 11/13/2016 | MAAC | Siena | 89 | Cornell | 78 | 6196 | Times Union Center | 15229 | 40.7% |
| 11/11/2016 | Big Ten | Penn State | 81 | Albany | 87 | 6230 | Bryce Jordan Center | 15261 | 40.8% |
| 11/12/2016 | MAC | Ohio | 77 | Southern | 67 | 6268 | Convocation Center (OH) | 13010 | 48.2% |
| 11/17/2016 | Pac 12 | Washington | 104 | CS Fullerton | 88 | 6284 | Alaska Airlines Arena | 12961 | 48.5% |
| 11/12/2016 | Conference USA | UTEP | 88 | Louisiana Coll. | 54 | 6295 | Don Haskins Center | 12222 | 51.5% |
| 11/13/2016 | Big East | Seton Hall | 82 | Cent Conn St | 58 | 6354 | Prudential Center | 17625 | 36.1% |
| 11/20/2016 | Mountain West | Nevada | 91 | Iona | 76 | 6375 | Lawlor Events Center | 11536 | 55.3% |
| 11/11/2016 | ACC | Pitt | 93 | E Michigan | 90 | 6411 | Petersen Events Center | 12508 | 51.3% |
| 11/14/2016 | SEC | Georgia | 60 | UNC Asheville | 46 | 6415 | Stegeman Coliseum | 11200 | 57.3% |
| 11/15/2016 | ACC | Virginia Tech | 99 | High Point | 73 | 6428 | Cassell Coliseum | 9847 | 65.3% |
| 11/11/2016 | Big East | Villanova | 88 | Lafayette | 48 | 6500 | The Pavilion (Villanova) | 7926 | 82.0% |
| 11/11/2016 | Big East | Cincinnati | 84 | Brown | 55 | 6504 | Fifth Third Arena | 13176 | 49.4% |
| 11/13/2016 | ACC | Wake Forest | 94 | Bucknell | 74 | 6541 | Lawrence Joel Coliseum | 14665 | 44.6% |
| 11/21/2016 | Big East | Butler | 91 | Norfolk State | 55 | 6593 | Hinkle Fieldhouse | 15000 | 44.0% |
| 11/16/2016 | ACC | Notre Dame | 92 | Seattle | 49 | 6598 | Purcell Pavilion | 9149 | 72.1% |
| 11/21/2016 | SEC | Florida | 78 | Belmont | 61 | 6650 | Amalie Arena | 20500 | 32.4% |
| 11/14/2016 | MAC | Ohio | 96 | Sam Houston | 75 | 6669 | Convocation Center (OH) | 13010 | 51.3% |
| 11/12/2016 | SEC | LSU | 91 | Wofford | 69 | 6690 | Pete Maravich Assembly Center | 14351 | 46.6% |
| 11/19/2016 | ACC | Miami | 74 | Penn | 62 | 6753 | Watsco Center | 7972 | 84.7% |
| 11/21/2016 | Big Ten | Northwestern | 77 | Texas | 58 | 6780 | Barclays Center | 17732 | 38.2% |
| 11/20/2016 | Pac 12 | Washington | 92 | N Arizona | 58 | 6804 | Alaska Airlines Arena | 12961 | 52.5% |
| 11/19/2016 | Mountain West | Wyoming | 77 | South Dakota St | 67 | 6833 | Arena-Auditorium | 15028 | 45.5% |
| 11/11/2016 | The American | SMU | 72 | Gardner-Webb | 44 | 6852 | Moody Coliseum | 8998 | 76.2% |
| 11/13/2016 | The American | SMU | 91 | E Michigan | 64 | 6852 | Moody Coliseum | 8998 | 76.2% |
| 11/12/2016 | ACC | FSU | 88 | Charleston So | 67 | 6880 | Donald L. Tucker Center | 12100 | 56.9% |
| 11/14/2016 | Pac 12 | Colorado | 67 | Seattle | 55 | 6883 | Coors Events Center | 11064 | 62.2% |
| 11/17/2016 | Pac 12 | UCLA | 88 | San Diego | 68 | 6893 | Pauley Pavilion | 12829 | 53.7% |
| 11/15/2016 | SEC | LSU | 78 | Southern Miss | 61 | 6942 | Pete Maravich Assembly Center | 14351 | 48.4% |
| 11/18/2016 | SEC | LSU | 78 | North Florida | 70 | 6953 | Pete Maravich Assembly Center | 14351 | 48.4% |
| 11/14/2016 | SEC | Auburn | 83 | Georgia State | 65 | 6980 | Auburn Arena | 9121 | 76.5% |
| 11/17/2016 | SEC | Auburn | 85 | E Kentucky | 64 | 6987 | Auburn Arena | 9121 | 76.6% |
| 11/12/2016 | ACC | Notre Dame | 89 | Bryant | 64 | 7062 | Purcell Pavilion | 9149 | 77.2% |
| 11/11/2016 | ACC | Miami | 92 | W Carolina | 43 | 7142 | Watsco Center | 7972 | 89.6% |
| 11/13/2016 | Pac 12 | UCLA | 102 | CS Northridge | 87 | 7149 | Pauley Pavilion | 12829 | 55.7% |
| 11/11/2016 | Atlantic 10 | Saint Louis | 64 | Ball State | 85 | 7165 | Chaifetz Arena | 10600 | 67.6% |
| 11/11/2016 | Pac 12 | Stanford | 80 | Harvard | 70 | 7196 | Mercedes-Benz Arena | 18000 | 40.0% |
| 11/11/2016 | Atlantic 10 | Richmond | 72 | VMI | 69 | 7201 | Robins Center | 9071 | 79.4% |
| 11/11/2016 | ACC | Wake Forest | 80 | Radford | 59 | 7233 | Lawrence Joel Coliseum | 14665 | 49.3% |
| 11/19/2016 | Big East | Butler | 86 | Bucknell | 60 | 7236 | Hinkle Fieldhouse | 15000 | 48.2% |
| 11/17/2016 | Pac 12 | Colorado | 89 | UL Monroe | 70 | 7329 | Coors Events Center | 11064 | 66.2% |
| 11/11/2016 | Pac 12 | Arizona State | 88 | Portland State | 70 | 7398 | Wells Fargo Arena (AZ) | 10754 | 68.8% |
| 11/13/2016 | Pac 12 | Washington | 90 | Yale | 98 | 7456 | Alaska Airlines Arena | 12961 | 57.5% |
| 11/17/2016 | Pac 12 | Oregon | 76 | Valparaiso | 54 | 7509 | Matthew Knight Arena | 12369 | 60.7% |
| 11/11/2016 | SEC | Texas A&M | 72 | Northwestern St | 44 | 7539 | Reed Arena | 12989 | 58.0% |
| 11/14/2016 | ACC | UConn | 61 | Northeastern | 64 | 7573 | Gampel Pavilion | 10167 | 74.5% |
| 11/11/2016 | Atlantic 10 | VCU | 80 | UNC Asheville | 65 | 7637 | Stuart C. Siegel Center | 7637 | 100.0% |
| 11/18/2016 | Atlantic 10 | VCU | 81 | Binghamton | 42 | 7637 | Stuart C. Siegel Center | 7637 | 100.0% |
| 11/19/2016 | ACC | Virginia Tech | 88 | VMI | 72 | 7714 | Cassell Coliseum | 9847 | 78.3% |
| 11/11/2016 | The American | Temple | 97 | La Salle | 92 | 7768 | Liacouras Center | 10206 | 76.1% |
| 11/11/2016 | Pac 12 | Cal | 82 | South Dakota St | 53 | 7782 | Haas Pavilion | 11877 | 65.5% |
| 11/14/2016 | Big 12 | West Virginia | 107 | Miss Valley St | 66 | 7807 | WVU Coliseum | 14000 | 55.8% |
| 11/12/2016 | Big East | Butler | 89 | N Colorado | 52 | 7836 | Hinkle Fieldhouse | 15000 | 52.2% |
| 11/16/2016 | Big East | Butler | 70 | Northwestern | 68 | 7858 | Hinkle Fieldhouse | 15000 | 52.4% |
| 11/16/2016 | Big Ten | Minnesota | 80 | Mt St Mary’s | 56 | 7940 | Williams Arena | 14625 | 54.3% |
| 11/14/2016 | Big Ten | Minnesota | 84 | UT-Arlington | 67 | 7986 | Williams Arena | 14625 | 54.6% |
| 11/12/2016 | Big East | Georgetown | 105 | USC Upstate | 60 | 8076 | Verizon Center | 18506 | 43.6% |
| 11/18/2016 | The American | SMU | 54 | Michigan | 76 | 8088 | Madison Square Garden | 19812 | 40.8% |
| 11/18/2016 | Mountain West | Nevada | 83 | Oregon State | 58 | 8090 | Lawlor Events Center | 11536 | 70.1% |
| 11/11/2016 | SEC | Auburn | 83 | North Florida | 66 | 8093 | Auburn Arena | 9121 | 88.7% |
| 11/16/2016 | Pac 12 | Cal | 75 | UC Irvine | 65 | 8104 | Haas Pavilion | 11877 | 68.2% |
| 11/17/2016 | Big East | Marquette | 61 | Michigan | 79 | 8126 | Madison Square Garden | 19812 | 41.0% |
| 11/18/2016 | SEC | Vanderbilt | 75 | Norfolk State | 52 | 8205 | Memorial Gymnasium (Vandy) | 15626 | 52.5% |
| 11/11/2016 | Conference USA | Old Dominion | 62 | JMU | 55 | 8241 | Ted Constant Convocation Center | 9520 | 86.6% |
| 11/21/2016 | SEC | Vanderbilt | 72 | Bucknell | 75 | 8243 | Memorial Gymnasium (Vandy) | 15626 | 52.8% |
| 11/20/2016 | Pac 12 | UCLA | 114 | LBSU | 77 | 8294 | Pauley Pavilion | 12829 | 64.7% |
| 11/14/2016 | Big East | Providence | 80 | Vermont | 58 | 8310 | Dunkin Donuts Center | 12400 | 67.0% |
| 11/11/2016 | Pac 12 | Colorado | 90 | Sacramento St | 53 | 8322 | Coors Events Center | 11064 | 75.2% |
| 11/11/2016 | Big Ten | Minnesota | 86 | LA-Lafayette | 74 | 8453 | Williams Arena | 14625 | 57.8% |
| 11/13/2016 | Big 12 | Oklahoma | 97 | Northwestern St | 61 | 8456 | Lloyd Noble Center | 11528 | 73.4% |
| 11/14/2016 | Mountain West | Utah State | 93 | NJIT | 84 | 8584 | Dee Glen Smith Spectrum | 10270 | 83.6% |
| 11/19/2016 | The American | Memphis | 99 | Savannah State | 86 | 8689 | FedExForum | 18119 | 48.0% |
| 11/16/2016 | Mountain West | UNLV | 74 | UC Riverside | 62 | 8711 | Thomas & Mack Center | 18776 | 46.4% |
| 11/11/2016 | Pac 12 | UCLA | 119 | Pacific | 80 | 8743 | Pauley Pavilion | 12829 | 68.2% |
| 11/18/2016 | SEC | Texas A&M | 63 | USC | 65 | 8749 | Reed Arena | 12989 | 67.4% |
| 11/20/2016 | Big 12 | West Virginia | 100 | UNH | 41 | 8842 | WVU Coliseum | 14000 | 63.2% |
| 11/18/2016 | Big Ten | Minnesota | 92 | St John’s | 86 | 8873 | Williams Arena | 14625 | 60.7% |
| 11/18/2016 | ACC | Notre Dame | 83 | Loyola (MD) | 48 | 8894 | Purcell Pavilion | 9149 | 97.2% |
| 11/14/2016 | Big 12 | Texas | 80 | UL Monroe | 59 | 8953 | Frank Erwin Center | 16837 | 53.2% |
| 11/11/2016 | ACC | Clemson | 74 | Georgia | 64 | 9000 | Littlejohn Coliseum | 9000 | 100.0% |
| 11/17/2016 | Big 12 | Texas | 85 | E Washington | 52 | 9072 | Frank Erwin Center | 16837 | 53.9% |
| 11/15/2016 | SEC | Vanderbilt | 80 | Belmont | 66 | 9116 | Memorial Gymnasium (Vandy) | 15626 | 58.3% |
| 11/20/2016 | MAAC | Marist | 72 | Grand Canyon | 84 | 9119 | Mohegan Sun Arena | 9323 | 97.8% |
| 11/20/2016 | America East | Albany | 80 | Brown | 76 | 9119 | Mohegan Sun Arena | 9323 | 97.8% |
| 11/14/2016 | The American | Memphis | 94 | UT Rio Grande | 75 | 9217 | FedExForum | 18119 | 50.9% |
| 11/13/2016 | SEC | South Carolina | 81 | Holy Cross | 49 | 9270 | Colonial Life Arena | 18000 | 51.5% |
| 11/11/2016 | ACC | Duke | 94 | Marist | 49 | 9314 | Cameron Indoor Stadium | 9314 | 100.0% |
| 11/12/2016 | ACC | Duke | 96 | Grand Canyon | 61 | 9314 | Cameron Indoor Stadium | 9314 | 100.0% |
| 11/16/2016 | The American | Memphis | 68 | Milwaukee | 54 | 9398 | FedExForum | 18119 | 51.9% |
| 11/19/2016 | Mountain West | UNLV | 77 | CS Fullerton | 68 | 9416 | Thomas & Mack Center | 18776 | 50.1% |
| 11/11/2016 | Big Ten | Michigan State | 63 | Arizona | 65 | 9475 | Stan Sheriff Center | 10300 | 92.0% |
| 11/11/2016 | Big 12 | Kansas | 99 | Indiana | 103 | 9475 | Stan Sheriff Center | 10300 | 92.0% |
| 11/21/2016 | Big Ten | Illinois | 80 | Winthrop | 84 | 9502 | State Farm Center | 15500 | 61.3% |
| 11/11/2016 | ACC | UConn | 58 | Wagner | 67 | 9523 | Gampel Pavilion | 10167 | 93.7% |
| 11/11/2016 | ACC | Virginia Tech | 80 | Maine | 67 | 9567 | Cassell Coliseum | 9847 | 97.2% |
| 11/11/2016 | Big 12 | Texas Tech | 93 | Houston Baptist | 67 | 9774 | United Supermarkets Arena | 15020 | 65.1% |
| 11/15/2016 | SEC | South Carolina | 70 | Monmouth | 69 | 9779 | Colonial Life Arena | 18000 | 54.3% |
| 11/14/2016 | Big Ten | OSU | 69 | NC Central | 63 | 9787 | Value City Arena | 18809 | 52.0% |
| 11/11/2016 | Mountain West | UNLV | 68 | South Alabama | 76 | 9981 | Thomas & Mack Center | 18776 | 53.2% |
| 11/21/2016 | Big 12 | Kansas | 83 | UAB | 63 | 10071 | Sprint Center | 18972 | 53.1% |
| 11/11/2016 | Big Ten | Michigan | 76 | Howard | 58 | 10094 | Crisler Center | 13751 | 73.4% |
| 11/21/2016 | Pac 12 | Cal | 65 | San Diego State | 77 | 10104 | Golden 1 Center | 17500 | 57.7% |
| 11/14/2016 | Big East | Xavier | 86 | Buffalo | 53 | 10116 | Cintas Center | 10250 | 98.7% |
| 11/15/2016 | Big Ten | Illinois | 112 | McKendree | 65 | 10135 | State Farm Center | 15500 | 65.4% |
| 11/15/2016 | Pac 12 | Utah | 96 | Concordia (OR) | 53 | 10179 | Jon M. Huntsman Center | 15000 | 67.9% |
| 11/11/2016 | Big East | Xavier | 84 | Lehigh | 81 | 10250 | Cintas Center | 10250 | 100.0% |
| 11/18/2016 | Big West | Hawai’i | 68 | UNC | 83 | 10300 | Stan Sheriff Center | 10300 | 100.0% |
| 11/17/2016 | Big Ten | Iowa | 83 | Seton Hall | 91 | 10391 | Carver-Hawkeye Arena | 15500 | 67.0% |
| 11/18/2016 | Big Ten | Illinois | 89 | Detroit Mercy | 69 | 10396 | State Farm Center | 15500 | 67.1% |
| 11/21/2016 | Big Ten | OSU | 66 | W Carolina | 38 | 10452 | Value City Arena | 18809 | 55.6% |
| 11/14/2016 | Mountain West | New Mexico | 95 | Houston Baptist | 79 | 10456 | WisePies Arena | 15411 | 67.8% |
| 11/13/2016 | Missouri Valley | Wichita State | 92 | LBSU | 55 | 10506 | Charles Koch Arena | 10506 | 100.0% |
| 11/16/2016 | Missouri Valley | Wichita State | 80 | Tulsa | 53 | 10506 | Charles Koch Arena | 10506 | 100.0% |
| 11/20/2016 | Missouri Valley | Wichita State | 116 | MD-E Shore | 79 | 10506 | Charles Koch Arena | 10506 | 100.0% |
| 11/11/2016 | Big 12 | West Virginia | 87 | Mt St Mary’s | 59 | 10510 | WVU Coliseum | 14000 | 75.1% |
| 11/18/2016 | Pac 12 | Utah | 94 | Coppin State | 51 | 10693 | Jon M. Huntsman Center | 15000 | 71.3% |
| 11/15/2016 | Big 12 | Kansas State | 81 | Omaha | 68 | 10751 | Bramlage Coliseum | 13762 | 78.1% |
| 11/11/2016 | Big Ten | Illinois | 81 | SE Missouri St | 62 | 10790 | State Farm Center | 15500 | 69.6% |
| 11/13/2016 | Big Ten | Michigan | 77 | IUPUI | 65 | 10812 | Crisler Center | 13751 | 78.6% |
| 11/15/2016 | SEC | Alabama | 72 | Dayton | 77 | 10834 | Coleman Coliseum | 15383 | 70.4% |
| 11/13/2016 | Big Ten | Illinois | 79 | N Kentucky | 64 | 10888 | State Farm Center | 15500 | 70.2% |
| 11/11/2016 | Big 12 | Texas | 78 | Incarnate Word | 73 | 10922 | Frank Erwin Center | 16837 | 64.9% |
| 11/17/2016 | Big Ten | OSU | 72 | Providence | 67 | 11089 | Value City Arena | 18809 | 59.0% |
| 11/12/2016 | Pac 12 | Utah | 81 | NW Nazarene | 37 | 11275 | Jon M. Huntsman Center | 15000 | 75.2% |
| 11/11/2016 | Mountain West | New Mexico | 81 | Idaho State | 70 | 11293 | WisePies Arena | 15411 | 73.3% |
| 11/14/2016 | Big East | Marquette | 81 | Howard | 49 | 11305 | BMO Harris Bradley Center | 17845 | 63.4% |
| 11/20/2016 | Big 12 | Kansas State | 89 | Hampton | 67 | 11316 | Bramlage Coliseum | 13762 | 82.2% |
| 11/13/2016 | Big Ten | Iowa | 116 | Savannah State | 84 | 11371 | Carver-Hawkeye Arena | 15500 | 73.4% |
| 11/20/2016 | Big Ten | Iowa | 95 | UT Rio Grande | 67 | 11596 | Carver-Hawkeye Arena | 15500 | 74.8% |
| 11/11/2016 | Big 12 | Kansas State | 82 | W Illinois | 55 | 11644 | Bramlage Coliseum | 13762 | 84.6% |
| 11/18/2016 | SEC | Alabama | 77 | Ball State | 59 | 11665 | Coleman Coliseum | 15383 | 75.8% |
| 11/15/2016 | SEC | Tennessee | 103 | Appalachian St | 94 | 11758 | Thompson-Boling Arena | 21678 | 54.2% |
| 11/11/2016 | Pac 12 | Oregon | 91 | Army | 77 | 12364 | Matthew Knight Arena | 12369 | 100.0% |
| 11/11/2016 | Mountain West | San Diego State | 69 | San Diego | 59 | 12414 | Viejas Arena | 12414 | 100.0% |
| 11/17/2016 | West Coast | BYU | 96 | Coppin State | 59 | 12444 | Marriott Center | 22700 | 54.8% |
| 11/19/2016 | Big Ten | Indiana | 87 | Liberty | 48 | 12537 | Assembly Hall (Indiana) | 17472 | 71.8% |
| 11/15/2016 | ACC | UNC | 93 | LBSU | 67 | 12581 | Dean E. Smith Center | 21750 | 57.8% |
| 11/11/2016 | Big Ten | Iowa | 91 | Kennesaw St | 74 | 13007 | Carver-Hawkeye Arena | 15500 | 83.9% |
| 11/11/2016 | Atlantic 10 | Dayton | 96 | Austin Peay | 68 | 13121 | University of Dayton Arena | 13435 | 97.7% |
| 11/19/2016 | Atlantic 10 | Dayton | 57 | Saint Mary’s | 61 | 13175 | University of Dayton Arena | 13435 | 98.1% |
| 11/14/2016 | SEC | Arkansas | 90 | S Illinois | 65 | 13308 | Bud Walton Arena | 20320 | 65.5% |
| 11/11/2016 | SEC | South Carolina | 85 | LA Tech | 76 | 13344 | Colonial Life Arena | 18000 | 74.1% |
| 11/13/2016 | ACC | UNC | 97 | Chattanooga | 57 | 13402 | Dean E. Smith Center | 21750 | 61.6% |
| 11/15/2016 | Big East | Georgetown | 75 | Maryland | 76 | 13455 | Verizon Center | 18506 | 72.7% |
| 11/11/2016 | Big Ten | Purdue | 109 | McNeese | 65 | 13523 | Mackey Arena | 14846 | 91.1% |
| 11/18/2016 | SEC | Arkansas | 71 | UT-Arlington | 67 | 13587 | Bud Walton Arena | 20320 | 66.9% |
| 11/11/2016 | SEC | Arkansas | 92 | Fort Wayne | 83 | 13787 | Bud Walton Arena | 20320 | 67.8% |
| 11/18/2016 | Mountain West | New Mexico | 72 | New Mexico St | 59 | 13892 | WisePies Arena | 15411 | 90.1% |
| 11/14/2016 | Big 12 | Iowa State | 73 | Mt St Mary’s | 55 | 13981 | Hilton Coliseum | 14356 | 97.4% |
| 11/15/2016 | Pac 12 | Arizona | 78 | CSU Bakersfield | 66 | 14214 | McKale Center | 14545 | 97.7% |
| 11/20/2016 | Big 12 | Iowa State | 130 | The Citadel | 63 | 14228 | Hilton Coliseum | 14356 | 99.1% |
| 11/20/2016 | ACC | UVA | 62 | Yale | 38 | 14242 | John Paul Jones Arena | 14593 | 97.6% |
| 11/18/2016 | Big Ten | Purdue | 64 | Georgia State | 56 | 14302 | Mackey Arena | 14846 | 96.3% |
| 11/17/2016 | ACC | Louisville | 88 | LBSU | 56 | 14337 | KFC Yum! Center | 22090 | 64.9% |
| 11/11/2016 | Big 12 | Iowa State | 113 | Savannah State | 71 | 14384 | Hilton Coliseum | 14356 | 100.2% |
| 11/18/2016 | Pac 12 | Arizona | 95 | Sacred Heart | 65 | 14392 | McKale Center | 14545 | 98.9% |
| 11/21/2016 | Pac 12 | Arizona | 71 | N Colorado | 55 | 14397 | McKale Center | 14545 | 99.0% |
| 11/15/2016 | ACC | UVA | 72 | St Francis (BKN) | 32 | 14471 | John Paul Jones Arena | 14593 | 99.2% |
| 11/11/2016 | SEC | Tennessee | 69 | Chattanooga | 82 | 14483 | Thompson-Boling Arena | 21678 | 66.8% |
| 11/11/2016 | SEC | Alabama | 70 | Coast Carolina | 53 | 14579 | Coleman Coliseum | 15383 | 94.8% |
| 11/13/2016 | ACC | NC State | 86 | St Francis (BKN) | 61 | 14792 | PNC Arena | 18680 | 79.2% |
| 11/18/2016 | Big Ten | Michigan State | 100 | Miss Valley St | 53 | 14797 | Breslin Center | 16280 | 90.9% |
| 11/20/2016 | Big Ten | Michigan State | 78 | FGCU | 77 | 14797 | Breslin Center | 16280 | 90.9% |
| 11/14/2016 | Big Ten | Purdue | 76 | Villanova | 79 | 14804 | Mackey Arena | 14846 | 99.7% |
| 11/19/2016 | West Coast | BYU | 81 | Coast Carolina | 65 | 15003 | Marriott Center | 22700 | 66.1% |
| 11/15/2016 | Big Ten | Nebraska | 70 | U of Mary | 38 | 15738 | Pinnacle Bank Arena | 15147 | 103.9% |
| 11/17/2016 | Big Ten | Maryland | 93 | StMaryMD | 45 | 15779 | XFINITY Center | 17950 | 87.9% |
| 11/19/2016 | Big Ten | Nebraska | 65 | LA Tech | 54 | 15824 | Pinnacle Bank Arena | 15147 | 104.5% |
| 11/13/2016 | Big Ten | Nebraska | 83 | Sacramento St | 61 | 15883 | Pinnacle Bank Arena | 15147 | 104.9% |
| 11/14/2016 | West Coast | BYU | 82 | Princeton | 73 | 15926 | Marriott Center | 22700 | 70.2% |
| 11/11/2016 | ACC | NC State | 81 | Ga Southern | 79 | 16226 | PNC Arena | 18680 | 86.9% |
| 11/18/2016 | Big 12 | Kansas | 86 | Siena | 65 | 16300 | Allen Fieldhouse | 16300 | 100.0% |
| 11/11/2016 | Big East | Creighton | 89 | UMKC | 82 | 16686 | CenturyLink Center Omaha | 17100 | 97.6% |
| 11/20/2016 | Big Ten | Maryland | 71 | Towson | 66 | 16797 | XFINITY Center | 17950 | 93.6% |
| 11/11/2016 | Big Ten | Maryland | 62 | American U | 56 | 17078 | XFINITY Center | 17950 | 95.1% |
| 11/16/2016 | Big Ten | Indiana | 100 | UMass Lowell | 78 | 17222 | Assembly Hall (Indiana) | 17472 | 98.6% |
| 11/17/2016 | Big Ten | Wisconsin | 69 | Chicago State | 51 | 17278 | Kohl Center | 17230 | 100.3% |
| 11/11/2016 | Big Ten | Wisconsin | 79 | Cent Arkansas | 47 | 17287 | Kohl Center | 17230 | 100.3% |
| 11/15/2016 | Big East | Creighton | 79 | Wisconsin | 67 | 17879 | CenturyLink Center Omaha | 17100 | 104.6% |
| 11/14/2016 | ACC | Louisville | 91 | William & Mary | 58 | 19314 | KFC Yum! Center | 22090 | 87.4% |
| 11/15/2016 | Big 12 | Kansas | 77 | Duke | 75 | 19812 | Madison Square Garden | 19812 | 100.0% |
| 11/11/2016 | ACC | Louisville | 78 | Evansville | 47 | 21129 | KFC Yum! Center | 22090 | 95.6% |
| 11/20/2016 | SEC | Kentucky | 93 | Duquesne | 59 | 21327 | Rupp Arena | 23500 | 90.8% |
| 11/15/2016 | ACC | Syracuse | 90 | Holy Cross | 46 | 21405 | Carrier Dome | 35446 | 60.4% |
| 11/13/2016 | SEC | Kentucky | 93 | Canisius | 69 | 22009 | Rupp Arena | 23500 | 93.7% |
| 11/18/2016 | ACC | Syracuse | 71 | Monmouth | 50 | 22636 | Carrier Dome | 35446 | 63.9% |
| 11/11/2016 | SEC | Kentucky | 87 | SF Austin | 64 | 22683 | Rupp Arena | 23500 | 96.5% |
| 11/11/2016 | ACC | Syracuse | 83 | Colgate | 55 | 23844 | Carrier Dome | 35446 | 67.3% |