The semester is now in full swing across the nation, giving tons of fans of [INSERT YOUR SCHOOL HERE] no excuses as to why they drew so poorly. Despite what fans of [INSERT YOUR SCHOOL HERE] think, I have nothing against the fine people of [INSERT YOUR SCHOOL HERE]. Anyway, let’s take a look at the numbers this week.
Number of games drawing fewer than 1,000 fans: 14
The three lowest attended games of the week? NOW WITH BONUS FOURTH GAME OF THE WEEK 1
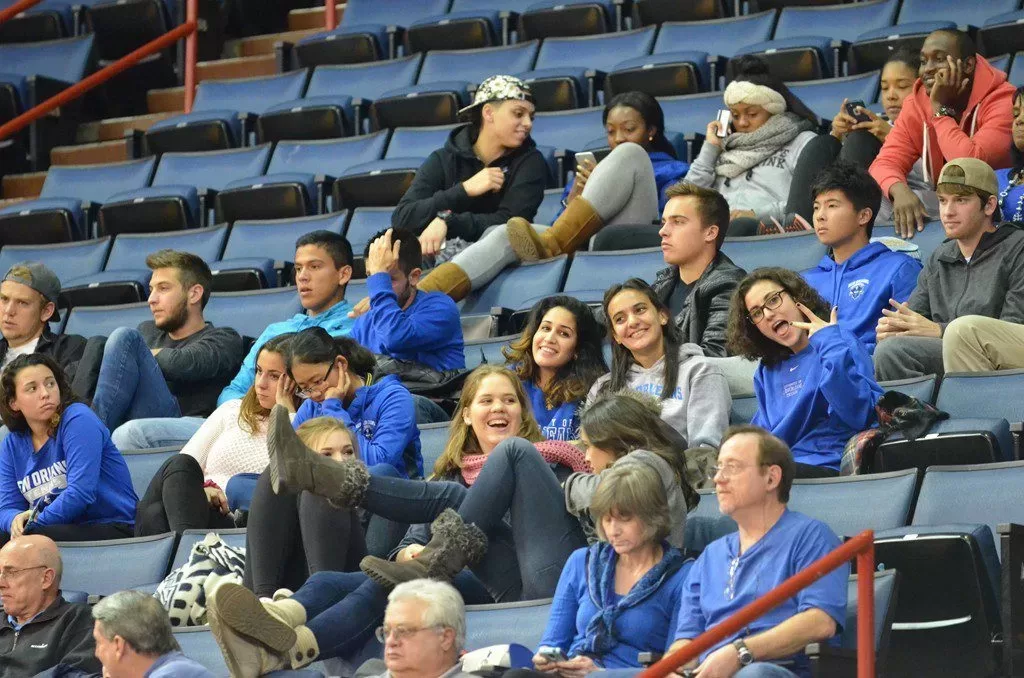
4. New Orleans vs Incarnate Word – The Cardinals of Incarnate Word have only been in Division 1 since 2013, which may explain the lack of general interest in the Big Easy to see them come in to town. A mere 481 came out to the Costello Athletic Center to see the home Privateers lose on a buzzer beater to Incarnate Word, 71-68. The good news in all this (for me at least) is that UNO has a photo gallery of every game. Here are a few action shots:


And my personal favorite:

This is over 5% of the crowd in one picture.
3. Chicago State vs CSU Bakersfield – In the Windy City, meanwhile, few came out to see the Cougars of Chicago State take on another new-to-D1 school in CSU Bakersfield, who joined in 2010. Only 450 were announced, which may have been made worse by the fact that the official Chicago State men’s basketball Twitter account has not tweeted since March of last year. Somewhere, Rovell has a sharp pain in his side due to someone’s mismanagement of their #Brand. However, to be fair, the weather in Chicago was less than adequate that night, as the CSU Bakersfield team learned the hard way:
Chicago down to 1 degree. Bus wouldnt start before game. 3 ubers, 1 cab, n 40 minute game later we got the road win! pic.twitter.com/TNyiGq71ep
— CSUB Men’s Hoops (@CSUB_MBB) January 12, 2016
The Roadrunners of CSU-B took this one 67-56 for the record, and are tied for the conference lead of the WAC with Grand Canyon (my how the WAC has fallen).
2. UMass-Lowell vs Maine – Yet another new-to-Division-1 team, this time as the hosts. The River Hawks of UMass-Lowell joined in 2013, and are still transitioning, and thus unable to play in the postseason until the 2018 NCAA Tournament. I don’t think that will be a concern as the Black Bears of Maine won handily by a score of 95-81. A whopping 443 filled the Costello Athletic Center.
1. St. Peter’s vs Marist – This one happened on Sunday, and is still the highest “lowest attendance game” of the year, drawing 321 spectators. Those spectators were treated to a victory as the Peacocks of St Peter’s ended up winning by 9 over the Red Foxes of Marist. Congratulations to St. Peter’s, you’re the best of the worst (so far)!!! #MAACtion
Here’s the miscellany for the week:
Biggest group of people to see a loss at home this week: Creighton (vs Providence), 17,073.
Smallest group of people to see a win at home this week: St. Peters (vs Marist), 321.
Smallest Power Conference attendance: Virginia Tech (vs Wake Forest), 4,985.
Average attendance this week: 5,894 (up 1,522 (34.8%) over last week)
And of course, your full attendance numbers:
| Date | Conference | Home Team | Home Score | Away Team | Away Score | Attendance | Venue | Capacity | % full |
|---|---|---|---|---|---|---|---|---|---|
| 1/17/2016 | MAAC | St Peter’s | 76 | Marist | 67 | 321 | Yanitelli Center | 3200 | 10.03% |
| 1/13/2016 | America East | UMass Lowell | 81 | Maine | 95 | 443 | Costello Athletic Center | 2100 | 21.10% |
| 1/11/2016 | Western Athletic | Chicago State | 56 | CSU Bakersfield | 67 | 450 | Jones Convocation Center | 7000 | 6.43% |
| 1/11/2016 | Southland | New Orleans | 68 | Incarnate Word | 71 | 481 | Lakefront Arena | 10000 | 4.81% |
| 1/13/2016 | Southland | Houston Baptist | 78 | Nicholls State | 69 | 517 | Sharp Gymnasium | 1500 | 34.47% |
| 1/12/2016 | Ivy League | Dartmouth | 80 | Canisius | 69 | 528 | Edward Leede Arena | 2100 | 25.14% |
| 1/11/2016 | MEAC | S Carolina St | 92 | NC A&T | 85 | 578 | S-H-M Memorial Center | 3200 | 18.06% |
| 1/11/2016 | MEAC | MD-E Shore | 69 | Morgan State | 65 | 671 | Hytche Arena | 5500 | 12.20% |
| 1/13/2016 | Patriot League | Colgate | 80 | Army | 66 | 720 | Cotterell Court | 3000 | 24.00% |
| 1/11/2016 | Southland | Sam Houston | 70 | SE Louisiana | 63 | 796 | Bernard G. Johnson Coliseum | 6110 | 13.03% |
| 1/11/2016 | Big South | Winthrop | 81 | Ferrum | 63 | 833 | Winthrop Coliseum | 6100 | 13.66% |
| 1/12/2016 | Ivy League | Harvard | 73 | Ryerson | 57 | 853 | Lavietes Pavilion | 2195 | 38.86% |
| 1/17/2016 | Patriot League | Army | 65 | American U | 45 | 912 | Christl Arena | 5043 | 18.08% |
| 1/11/2016 | SWAC | Alcorn State | 69 | Grambling St | 53 | 954 | Davey Whitney Complex | 7000 | 13.63% |
| 1/15/2016 | MAAC | Fairfield | 73 | Niagara | 68 | 1014 | Webster Bank Arena | 10000 | 10.14% |
| 1/13/2016 | Patriot League | American U | 50 | Boston U | 61 | 1029 | Bender Arena | 4500 | 22.87% |
| 1/15/2016 | MAAC | Manhattan | 62 | Canisius | 65 | 1029 | Draddy Gymnasium | 2345 | 43.88% |
| 1/11/2016 | Patriot League | Lehigh | 76 | Bucknell | 82 | 1042 | Stabler Arena | 6000 | 17.37% |
| 1/11/2016 | Southern | Wofford | 68 | Chattanooga | 77 | 1108 | Benjamin Johnson Arena | 3500 | 31.66% |
| 1/11/2016 | MEAC | Savannah State | 46 | NC Central | 69 | 1230 | Tiger Arena | 6000 | 20.50% |
| 1/13/2016 | Ohio Valley | SE Missouri St | 60 | Jacksonville St | 74 | 1275 | Show Me Center | 6972 | 18.29% |
| 1/11/2016 | Southern | Furman | 77 | Samford | 57 | 1304 | Timmons Arena | 4000 | 32.60% |
| 1/12/2016 | MAC | E Michigan | 81 | Buffalo | 69 | 1333 | Convocation Center (MI) | 8824 | 15.11% |
| 1/13/2016 | Patriot League | Lafayette | 65 | Holy Cross | 52 | 1335 | Kirby Sports Center | 4000 | 33.38% |
| 1/17/2016 | MAAC | Quinnipiac | 53 | Canisius | 63 | 1377 | TD Bank Sports Center | 3570 | 38.57% |
| 1/17/2016 | Southern | UNC Greensboro | 85 | VMI | 68 | 1381 | Greensboro Coliseum | 21273 | 6.49% |
| 1/13/2016 | Missouri Valley | Loyola (CHI) | 53 | Bradley | 54 | 1386 | Joseph J. Gentile Center | 4486 | 30.90% |
| 1/13/2016 | Mountain West | San Jose State | 62 | Wyoming | 55 | 1395 | Event Center (San Jose St.) | 5000 | 27.90% |
| 1/15/2016 | America East | Maine | 81 | Albany | 79 | 1406 | Cross Insurance Center | 5800 | 24.24% |
| 1/15/2016 | MAAC | Quinnipiac | 52 | Siena | 64 | 1428 | TD Bank Sports Center | 3570 | 40.00% |
| 1/17/2016 | MAAC | Manhattan | 69 | Niagara | 64 | 1492 | Draddy Gymnasium | 2345 | 63.62% |
| 1/11/2016 | Southern | W Carolina | 83 | UNC Greensboro | 77 | 1497 | Ramsey Center | 7826 | 19.13% |
| 1/13/2016 | Ohio Valley | UT Martin | 96 | Tenn Tech | 90 | 1497 | Skyhawk Arena | 5000 | 29.94% |
| 1/13/2016 | Atlantic 10 | Duquesne | 81 | Saint Louis | 71 | 1506 | A.J. Palumbo Center | 4406 | 34.18% |
| 1/10/2016 | Horizon League | Detroit | 74 | Valparaiso | 92 | 1513 | Calihan Hall | 8295 | 18.24% |
| 1/17/2016 | MAAC | Rider | 79 | Iona | 75 | 1517 | Alumni Gymnasium (Rider) | 1650 | 91.94% |
| 1/11/2016 | Southland | Lamar | 82 | Texas A&M-CC | 91 | 1539 | Montagne Center | 10080 | 15.27% |
| 1/11/2016 | SWAC | Southern | 74 | Jackson State | 66 | 1579 | F. G. Clark Activity Center | 7500 | 21.05% |
| 1/13/2016 | America East | Binghamton | 72 | Hartford | 76 | 1663 | Events Center (Binghamton) | 5142 | 32.34% |
| 1/13/2016 | Patriot League | Navy | 60 | Loyola (MD) | 52 | 1698 | Alumni Hall | 5710 | 29.74% |
| 1/11/2016 | MEAC | Norfolk State | 70 | Bethune-Cookman | 72 | 1756 | Echols Hall | 7000 | 25.09% |
| 1/12/2016 | Southland | SF Austin | 85 | Cent Arkansas | 64 | 2142 | William R. Johnson Coliseum | 7203 | 29.74% |
| 1/10/2016 | The American | Tulane | 67 | Tulsa | 81 | 2234 | Devlin Fieldhouse | 3600 | 62.06% |
| 1/12/2016 | MAC | Cent Michigan | 92 | Akron | 81 | 2260 | McGuirk Arena | 5300 | 42.64% |
| 1/12/2016 | America East | Albany | 80 | UNH | 75 | 2363 | SEFCU Arena | 4538 | 52.07% |
| 1/13/2016 | America East | Stony Brook | 86 | UMBC | 74 | 2381 | Island Federal Credit Union Arena | 4000 | 59.53% |
| 1/10/2016 | Atlantic 10 | Fordham | 82 | Richmond | 93 | 2385 | Rose Hill Gymnasium | 3470 | 68.73% |
| 1/11/2016 | Southern | ETSU | 88 | VMI | 51 | 2416 | Freedom Hall Civic Center | 5619 | 43.00% |
| 1/10/2016 | Horizon League | Oakland | 86 | UIC | 61 | 2473 | Athletics Center O’rena | 4005 | 61.75% |
| 1/12/2016 | Atlantic 10 | UMass | 70 | G Washington | 81 | 2571 | William D. Mullins Memorial Center | 9493 | 27.08% |
| 1/12/2016 | MAC | Kent State | 76 | Miami (OH) | 68 | 2588 | MAC Center | 6327 | 40.90% |
| 1/12/2016 | Big East | USF | 70 | Tulane | 81 | 2657 | USF Sun Dome | 10411 | 25.52% |
| 1/13/2016 | Atlantic 10 | George Mason | 73 | Saint Joe’s | 87 | 3044 | EagleBank Arena | 10000 | 30.44% |
| 1/10/2016 | Big East | USF | 51 | Cincinnati | 54 | 3062 | USF Sun Dome | 10411 | 29.41% |
| 1/17/2016 | Missouri Valley | Drake | 76 | S Illinois | 81 | 3136 | The Knapp Center | 7152 | 43.85% |
| 1/13/2016 | Summit League | North Dakota St | 66 | South Dakota | 65 | 3153 | Scheels Arena | 6000 | 52.55% |
| 1/13/2016 | Atlantic 10 | St Bonaventure | 69 | URI | 64 | 3219 | Reilly Center | 5480 | 58.74% |
| 1/11/2016 | MEAC | Hampton | 71 | Florida A&M | 65 | 3456 | Convocation Center (VA) | 7200 | 48.00% |
| 1/13/2016 | Missouri Valley | Indiana State | 74 | Northern Iowa | 60 | 3544 | Hulman Center | 10200 | 34.75% |
| 1/12/2016 | Missouri Valley | Evansville | 84 | Drake | 65 | 4011 | Ford Center | 19164 | 20.93% |
| 1/13/2016 | Mountain West | Colorado State | 62 | San Diego State | 69 | 4018 | Moby Arena | 8745 | 45.95% |
| 1/10/2016 | Atlantic 10 | Saint Joe’s | 72 | URI | 67 | 4080 | Hagan Arena | 4200 | 97.14% |
| 1/12/2016 | MAC | Toledo | 66 | N Illinois | 71 | 4271 | Savage Arena | 9000 | 47.46% |
| 1/12/2016 | Missouri Valley | S Illinois | 81 | Illinois State | 78 | 4441 | SIU Arena | 8339 | 53.26% |
| 1/13/2016 | ACC | Virginia Tech | 93 | Wake Forest | 91 | 4985 | Cassell Coliseum | 9847 | 50.62% |
| 1/15/2016 | MAC | Toledo | 78 | Akron | 64 | 5130 | Savage Arena | 9000 | 57.00% |
| 1/15/2016 | Missouri Valley | Illinois State | 55 | Evansville | 66 | 5148 | Redbird Arena | 10200 | 50.47% |
| 1/13/2016 | Atlantic 10 | Richmond | 83 | La Salle | 61 | 5257 | Robins Center | 9071 | 57.95% |
| 1/17/2016 | Big East | DePaul | 80 | Creighton | 91 | 5534 | Allstate Arena | 17500 | 31.62% |
| 1/13/2016 | Big 12 | Baylor | 82 | TCU | 54 | 5764 | Ferrell Center | 10347 | 55.71% |
| 1/13/2016 | The American | ECU | 55 | SMU | 79 | 6022 | Minges Coliseum | 8000 | 75.28% |
| 1/13/2016 | Big East | Villanova | 83 | Marquette | 68 | 6500 | The Pavilion (Villanova) | 6500 | 100.00% |
| 1/12/2016 | SEC | Missouri | 61 | Arkansas | 94 | 6627 | Mizzou Arena | 15061 | 44.00% |
| 1/10/2016 | The American | SMU | 88 | UCF | 73 | 6952 | Moody Coliseum | 8998 | 77.26% |
| 1/17/2016 | Atlantic 10 | Saint Louis | 79 | George Mason | 92 | 7022 | Chaifetz Arena | 10600 | 66.25% |
| 1/12/2016 | MAC | Ohio | 75 | Bowling Green | 91 | 7083 | Convocation Center | 10563 | 67.05% |
| 1/12/2016 | Big Ten | Northwestern | 70 | Wisconsin | 65 | 7264 | Welsh-Ryan Arena | 8117 | 89.49% |
| 1/10/2016 | Pac 12 | Oregon | 71 | Stanford | 58 | 7318 | Matthew Knight Arena | 12369 | 59.16% |
| 1/13/2016 | Mountain West | Nevada | 67 | Boise State | 74 | 7564 | Lawlor Events Center | 11536 | 65.57% |
| 1/13/2016 | Atlantic 10 | VCU | 88 | Fordham | 54 | 7637 | Stuart C. Siegel Center | 7617 | 100.26% |
| 1/13/2016 | Missouri Valley | Missouri State | 62 | Wichita State | 78 | 7684 | JQH Arena | 11000 | 69.85% |
| 1/13/2016 | ACC | Notre Dame | 72 | Georgia Tech | 64 | 7795 | Purcell Pavilion | 9149 | 85.20% |
| 1/13/2016 | Big East | St John’s | 73 | Georgetown | 93 | 7837 | Madison Square Garden | 19812 | 39.56% |
| 1/13/2016 | SEC | Georgia | 81 | Tennessee | 72 | 8029 | Stegeman Coliseum | 11200 | 71.69% |
| 1/17/2016 | Pac 12 | Colorado | 91 | Oregon | 87 | 8459 | Coors Events Center | 11064 | 76.46% |
| 1/10/2016 | Atlantic 10 | Saint Louis | 56 | VCU | 72 | 8719 | Chaifetz Arena | 10600 | 82.25% |
| 1/10/2016 | Big East | Butler | 55 | Villanova | 60 | 9144 | Hinkle Fieldhouse | 15000 | 60.96% |
| 1/17/2016 | ACC | FSU | 69 | UVA | 62 | 9158 | Donald L. Tucker Center | 12100 | 75.69% |
| 1/13/2016 | Pac 12 | Colorado | 71 | Oregon State | 54 | 9190 | Coors Events Center | 11064 | 83.06% |
| 1/12/2016 | Mountain West | Utah State | 79 | Air Force | 60 | 9243 | Dee Glen Smith Spectrum | 10270 | 90.00% |
| 1/13/2016 | Big East | Cincinnati | 70 | Houston | 59 | 9345 | Fifth Third Arena | 13176 | 70.92% |
| 1/13/2016 | Big 12 | Oklahoma State | 72 | Oklahoma | 74 | 9380 | Gallagher-Iba Arena | 13611 | 68.91% |
| 1/10/2016 | ACC | Clemson | 66 | Louisville | 62 | 9562 | Bon Secours Wellness Arena | 14897 | 64.19% |
| 1/12/2016 | SEC | Texas A&M | 71 | Florida | 68 | 9766 | Reed Arena | 12989 | 75.19% |
| 1/12/2016 | Big East | Xavier | 84 | DePaul | 64 | 10400 | Cintas Center | 10250 | 101.46% |
| 1/12/2016 | SEC | Vanderbilt | 75 | Auburn | 57 | 10414 | Memorial Gymnasium (Vandy) | 15626 | 66.65% |
| 1/17/2016 | Missouri Valley | Wichita State | 82 | Indiana State | 62 | 10506 | Charles Koch Arena | 10506 | 100.00% |
| 1/12/2016 | Big 12 | Texas | 94 | Iowa State | 91 | 10663 | Frank Erwin Center | 16837 | 63.33% |
| 1/10/2016 | Big Ten | Penn State | 65 | Michigan State | 92 | 10855 | Bryce Jordan Center | 15261 | 71.13% |
| 1/12/2016 | Mountain West | UNLV | 86 | New Mexico | 74 | 11377 | Thomas & Mack Center | 18776 | 60.59% |
| 1/13/2016 | Big Ten | OSU | 94 | Rutgers | 68 | 11635 | Value City Arena | 18809 | 61.86% |
| 1/10/2016 | ACC | Wake Forest | 77 | NC State | 74 | 11865 | Lawrence Joel Coliseum | 14665 | 80.91% |
| 1/12/2016 | Big 12 | West Virginia | 74 | Kansas | 63 | 12097 | WVU Coliseum | 14000 | 86.41% |
| 1/13/2016 | SEC | LSU | 90 | Ole Miss | 81 | 12133 | Pete Maravich Assembly Center | 14351 | 84.54% |
| 1/10/2016 | Big Ten | Illinois | 84 | Purdue | 70 | 12246 | State Farm Center | 15500 | 79.01% |
| 1/13/2016 | The American | Memphis | 67 | Temple | 65 | 12247 | FedExForum | 18119 | 67.59% |
| 1/12/2016 | Atlantic 10 | Dayton | 80 | Davidson | 74 | 12310 | University of Dayton Arena | 13435 | 91.63% |
| 1/12/2016 | Big 12 | Kansas State | 83 | Texas Tech | 70 | 12316 | Bramlage Coliseum | 13762 | 89.49% |
| 1/17/2016 | Pac 12 | Utah | 59 | Oregon State | 53 | 12417 | Jon M. Huntsman Center | 15000 | 82.78% |
| 1/13/2016 | SEC | Alabama | 73 | South Carolina | 50 | 12443 | Coleman Coliseum | 15383 | 80.89% |
| 1/15/2016 | Atlantic 10 | Dayton | 77 | G Washington | 70 | 12831 | University of Dayton Arena | 13435 | 95.50% |
| 1/13/2016 | ACC | Clemson | 68 | Duke | 63 | 12972 | Bon Secours Wellness Arena | 14897 | 87.08% |
| 1/13/2016 | Pac 12 | UCLA | 75 | USC | 89 | 12993 | Pauley Pavilion | 12829 | 101.28% |
| 1/13/2016 | Big Ten | Purdue | 74 | Penn State | 57 | 13802 | Mackey Arena | 14123 | 97.73% |
| 1/17/2016 | Big Ten | Iowa | 82 | Michigan | 71 | 15400 | Carver-Hawkeye Arena | 15500 | 99.35% |
| 1/12/2016 | Big Ten | Nebraska | 84 | Minnesota | 59 | 15628 | Pinnacle Bank Arena | 15147 | 103.18% |
| 1/10/2016 | Big Ten | Indiana | 85 | OSU | 60 | 16382 | Assembly Hall (Indiana) | 17472 | 93.76% |
| 1/13/2016 | ACC | Syracuse | 62 | Boston College | 40 | 16701 | Carrier Dome | 35446 | 47.12% |
| 1/13/2016 | ACC | NC State | 78 | FSU | 85 | 16846 | PNC Arena | 18680 | 90.18% |
| 1/12/2016 | Big East | Creighton | 48 | Providence | 50 | 17073 | CenturyLink Center Omaha | 17100 | 99.84% |
| 1/17/2016 | Big Ten | Wisconsin | 77 | Michigan State | 76 | 17287 | Kohl Center | 17230 | 100.33% |
| 1/12/2016 | SEC | Kentucky | 80 | Miss St | 74 | 23897 | Rupp Arena | 23500 | 101.69% |