The Long Road to the 2018 Final Four: How Far Will Each NCAA Tournament Team Have to Travel?
We've heard it before: The Road to the Final Four is long and painful. But exactly how long is it? For some of the teams, it seems like they always get opening round games right down the road[note]Duke has to go ALL THE WAY TO PITTSBURGH THIS YEAR, THE HORROR[/note]. For the rest of us, it seems like our team has to cross nine time zones to even get to the Sweet 16. Well, I did the work so you didn't have to. Using some base assumptions, I plugged in the numbers to see who, exactly, has the longest way still to go. The answer may surprise you.
Assumptions:
 Unfortunately for 64 of them, that's not how it will work. Here are some individual statistics. The average First a look at the average distance traveled by seed:
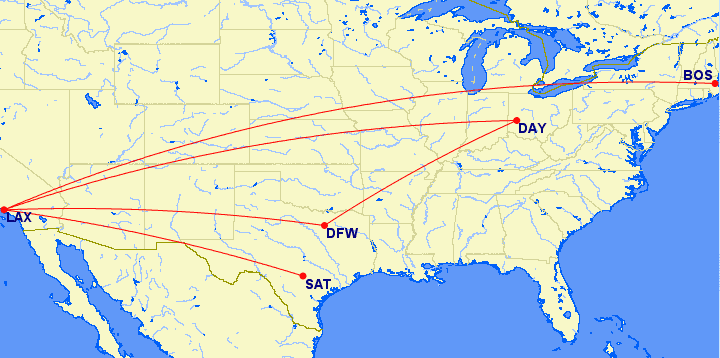
Longest overall journey to the Final Four: UCLA, with the help of the play-in game, has to travel 10,454 miles. From Dayton they potentially head to Dallas, before headed all the way back home, then back across the country to Boston and back before finally heading to San Antonio, should they be so lucky. Here's the map:
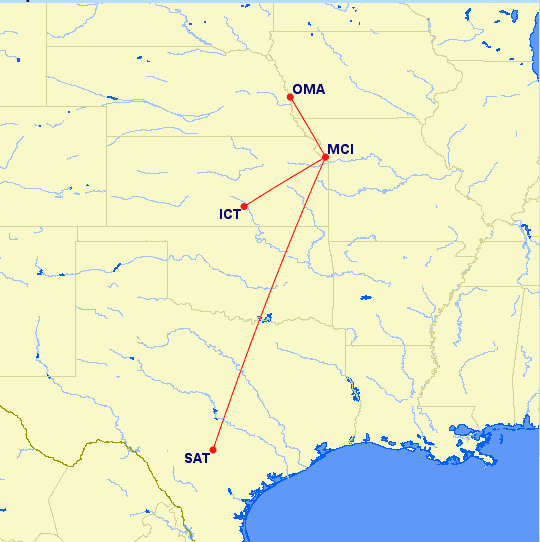
 Shortest overall journey to the Final Four: For the second straight year, it's Kansas, who has only 1,382 miles to travel[note]Except for Georgia State, who is playing in the Atlanta region, oops[/note]. This journey looks a lot less challenging:
 Longest journey to the Final Four for a 1 seed: Xavier, who at 5,284 miles, will travel almost twice as far as the next closest 1 seed (UVA).
Shortest journey to the Final Four for a 16 seed: LIU-Brooklyn, 3,069 miles. Don't worry, it didn't happen.
Average journey by region: South (4,220), Midwest (4,771), East (4,972), West (5,782)
Seed with shortest average journey: One seed, with an average of 2,988 miles. Seems fair.
Seed with longest average journey: 13, averaging 7,495 miles. Thanks, UNC-Greensboro!
Here's the raw data so you can see how your team stacks up...
Full results by team:
Longest journey to the Final Four for a 1 seed: Xavier, who at 5,284 miles, will travel almost twice as far as the next closest 1 seed (UVA).
Shortest journey to the Final Four for a 16 seed: LIU-Brooklyn, 3,069 miles. Don't worry, it didn't happen.
Average journey by region: South (4,220), Midwest (4,771), East (4,972), West (5,782)
Seed with shortest average journey: One seed, with an average of 2,988 miles. Seems fair.
Seed with longest average journey: 13, averaging 7,495 miles. Thanks, UNC-Greensboro!
Here's the raw data so you can see how your team stacks up...
Full results by team:
- During the NCAA tournament, the NCAA itself charters aircraft to bring teams to games. I assume that they generally use the closest reasonable airport. In major metro areas I tend to use the "major" airport, but I realize that Cincinnati might fly out of Lunken Field instead of Cincinnati[note]Covington*[/note] International Airport, the numbers do not materially change. I promise, I tested. When I did this for the upcoming Major League Baseball season, people got really mad about this. I re-ran the numbers and they changed by less than .01%, so settle down.
- Given that for under 350 miles teams are bused, this assumes the point to point distance (as the crow flies) rather than road distance on shorter journeys. This is done to maintain apples-to-apples comparisons.
- Teams will NOT go home after Dayton, but proceed to the next stop on their journey. For the rest of the venues, once they advance through their region, they will go home on Saturday or Sunday and fly on to the next region the following Wednesday or whatever. So in this example, Purdue goes home after Detroit and after Boston.
- Since this is mileage TO the Final Four, I don't consider a trip home. That would be some different article that's less interesting.
Unfortunately for 64 of them, that's not how it will work. Here are some individual statistics. The average First a look at the average distance traveled by seed:
| Seed | Mileage |
| 1 | 2988 |
| 2 | 3796 |
| 3 | 4142 |
| 14 | 4200 |
| 6 | 4247 |
| 10 | 4458 |
| 8 | 4475 |
| 16 | 4543 |
| 9 | 4667 |
| 12 | 5162 |
| 15 | 5314 |
| 4 | 5412 |
| 11 | 5583 |
| 7 | 5861 |
| 5 | 6709 |
| 13 | 7495 |
Shortest overall journey to the Final Four: For the second straight year, it's Kansas, who has only 1,382 miles to travel[note]Except for Georgia State, who is playing in the Atlanta region, oops[/note]. This journey looks a lot less challenging:
Longest journey to the Final Four for a 1 seed: Xavier, who at 5,284 miles, will travel almost twice as far as the next closest 1 seed (UVA).
Shortest journey to the Final Four for a 16 seed: LIU-Brooklyn, 3,069 miles. Don't worry, it didn't happen.
Average journey by region: South (4,220), Midwest (4,771), East (4,972), West (5,782)
Seed with shortest average journey: One seed, with an average of 2,988 miles. Seems fair.
Seed with longest average journey: 13, averaging 7,495 miles. Thanks, UNC-Greensboro!
Here's the raw data so you can see how your team stacks up...
Full results by team:
| Team | Seed | Region | Home | 1st Four | 64/32 | 16/8 | Final Four | Mileage |
|---|---|---|---|---|---|---|---|---|
| Georgia State | 15 | South | ATL | BNA | ATL | SAT | 1302 | |
| Kansas | 1 | Midwest | MCI | ICT | OMA | SAT | 1382 | |
| Cincinnati | 2 | South | CVG | BNA | ATL | SAT | 2231 | |
| Michigan State | 3 | Midwest | LAN | DTW | OMA | SAT | 2524 | |
| Villanova | 1 | East | PHL | PIT | BOS | SAT | 2591 | |
| Virginia | 1 | South | CHO | CLT | ATL | SAT | 2695 | |
| Tennessee | 3 | South | TYS | DFW | ATL | SAT | 2793 | |
| Virginia Tech | 8 | East | ROA | PIT | BOS | SAT | 2810 | |
| LIU-Brooklyn | 16 | East | JFK | DAY | PIT | BOS | SAT | 3069 |
| Butler | 10 | East | IND | DTW | BOS | SAT | 3084 | |
| Radford | 16 | East | ROA | DAY | PIT | BOS | SAT | 3097 |
| Purdue | 2 | East | LAF | DTW | BOS | SAT | 3117 | |
| Texas | 10 | South | AUS | BNA | ATL | SAT | 3205 | |
| Oklahoma | 10 | Midwest | OKC | PIT | OMA | SAT | 3263 | |
| UMBC | 16 | South | BWI | CLT | ATL | SAT | 3283 | |
| TCU | 6 | Midwest | DFW | DTW | OMA | SAT | 3386 | |
| NM State | 12 | Midwest | ELP | SAN | OMA | SAT | 3519 | |
| Stephen F. Austin | 14 | East | OCH | DFW | BOS | SAT | 3593 | |
| Wright State | 14 | South | DAY | DFW | ATL | SAT | 3665 | |
| San Diego State | 11 | West | SAN | ICT | LAX | SAT | 3680 | |
| Loyola-Chicago | 11 | South | ORD | DFW | ATL | SAT | 3857 | |
| Duke | 2 | Midwest | RDU | PIT | OMA | SAT | 3874 | |
| Kansas State | 9 | South | MHK | CLT | ATL | SAT | 4046 | |
| Gonzaga | 4 | West | GEG | BOI | LAX | SAT | 4074 | |
| Houston | 6 | West | HOU | ICT | LAX | SAT | 4103 | |
| Bucknell | 14 | Midwest | IPT | DTW | OMA | SAT | 4104 | |
| Alabama | 9 | East | TCL | PIT | BOS | SAT | 4189 | |
| Creighton | 8 | South | OMA | CLT | ATL | SAT | 4294 | |
| Missouri | 8 | West | COU | BNA | LAX | SAT | 4432 | |
| Texas Tech | 3 | East | LBB | DFW | BOS | SAT | 4458 | |
| St. Bonaventure | 11 | East | BFD | DAY | DFW | BOS | SAT | 4545 |
| Miami | 6 | South | MIA | DFW | ATL | SAT | 4574 | |
| Arkansas | 7 | East | XNA | DTW | BOS | SAT | 4579 | |
| Iona | 15 | Midwest | HPN | PIT | OMA | SAT | 4598 | |
| Syracuse | 11 | Midwest | SYR | DAY | DTW | OMA | SAT | 4608 |
| Texas A&M | 7 | West | CLL | CLT | LAX | SAT | 4663 | |
| Texas Southern | 16 | West | HOU | DAY | BNA | LAX | SAT | 4880 |
| Florida | 6 | East | GNV | DFW | BOS | SAT | 4926 | |
| Kentucky | 5 | South | LEX | BOI | ATL | SAT | 4976 | |
| Lipscomb | 15 | West | BNA | CLT | LAX | SAT | 5074 | |
| Florida State | 9 | West | PNS | BNA | LAX | SAT | 5136 | |
| Rhode Island | 7 | Midwest | PVD | PIT | OMA | SAT | 5193 | |
| Xavier | 1 | West | CVG | BNA | LAX | SAT | 5284 | |
| NC State | 9 | Midwest | RDU | ICT | OMA | SAT | 5298 | |
| Montana | 14 | West | MSO | ICT | LAX | SAT | 5437 | |
| Davidson | 12 | South | CLT | BOI | ATL | SAT | 5463 | |
| Arizona | 4 | South | TUS | BOI | ATL | SAT | 5525 | |
| South Dakota State | 12 | West | FSD | BOI | LAX | SAT | 5605 | |
| Wichita St | 4 | East | ICT | SAN | BOS | SAT | 5761 | |
| North Carolina | 2 | West | RDU | CLT | LAX | SAT | 5962 | |
| Murray State | 12 | East | PAH | SAN | BOS | SAT | 6059 | |
| Penn | 16 | Midwest | PHL | ICT | OMA | SAT | 6083 | |
| Auburn | 4 | Midwest | CSG | SAN | OMA | SAT | 6287 | |
| Arizona State | 11 | Midwest | PHX | DAY | DTW | OMA | SAT | 6354 |
| Seton Hall | 8 | Midwest | EWR | ICT | OMA | SAT | 6363 | |
| Marshall | 13 | East | HTS | SAN | BOS | SAT | 6387 | |
| West Virginia | 5 | East | MGW | SAN | BOS | SAT | 6509 | |
| Buffalo | 13 | South | BUF | BOI | ATL | SAT | 6609 | |
| Clemson | 5 | Midwest | GSP | SAN | OMA | SAT | 6764 | |
| Michigan | 3 | West | DTW | ICT | LAX | SAT | 6793 | |
| NC Central | 16 | West | RDU | DAY | BNA | LAX | SAT | 6843 |
| College of Charleston | 13 | Midwest | CHS | SAN | OMA | SAT | 7510 | |
| Providence | 10 | West | PVD | CLT | LAX | SAT | 8280 | |
| Ohio State | 5 | West | CMH | BOI | LAX | SAT | 8585 | |
| Nevada | 7 | South | RNO | BNA | ATL | SAT | 9008 | |
| UNC Greensboro | 13 | West | GSO | BOI | LAX | SAT | 9472 | |
| CSU Fullerton | 15 | East | SNA | DTW | BOS | SAT | 10281 | |
| UCLA | 11 | East | LAX | DAY | DFW | BOS | SAT | 10454 |