Week 9 NCAA Basketball Attendance: Sacred Heart Draws Sub-300 Twice
Sacred Heart is the focal point this week as they drew fewer than 550 fans over two games this week, surprisingly low as the Pioneers had drawn over 500 for most of the season thus far. The other story this week is the continued issues that HBCUs face in getting butts in seats, with two HBCUs sitting in the bottom three[note]Okay, it's four this week[/note] yet again. Let's take a look, shall we?
Number of games drawing fewer than 1,000 fans: 52 (Season total: 313)
Here are the 3 lowest attended games of last week:
3. Southern vs SE Louisiana - SWAC schools continue to struggle to fill seats as Southern managed only 328 to see them play Southeastern Louisiana on Wednesday. The Lions of SE Louisiana ended up getting the road win 64-53 and dropping the Southern Jaguars to 4-9 this season.
2. Sacred Heart vs Robert Morris and St. Francis (PA) - For the second time this year, a team had two games in the bottom three this week, so they've been combined into one entry. The Pioneers hosted Robert Morris on Thursday in front of 242, losing 78-67. Then on Saturday they hosted St. Francis of PA and drew a whopping 275 fans. The St. Francis game was so intense that the fans in the background were seen DOING OTHER STUFF ON THEIR LAPTOP:
[caption id="attachment_2468" align="aligncenter" width="2000"]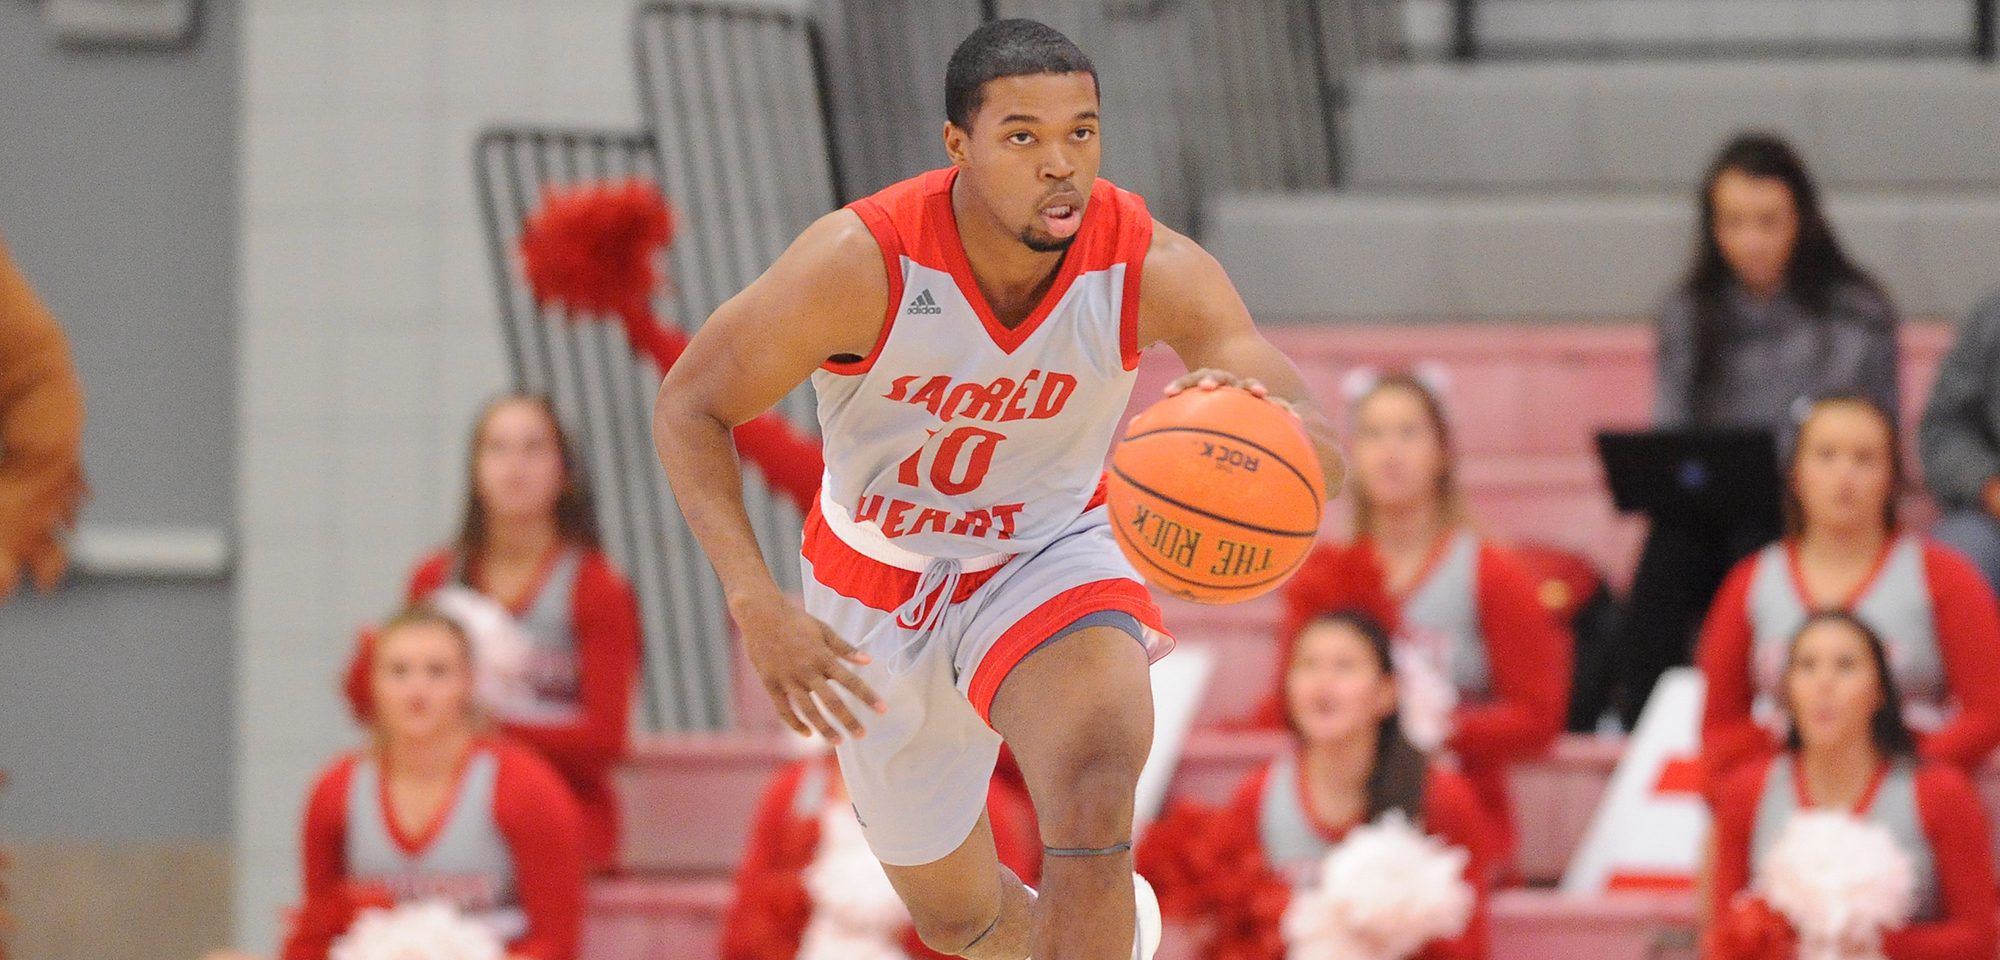 Image courtesy SacredHeartPioneers.com[/caption]
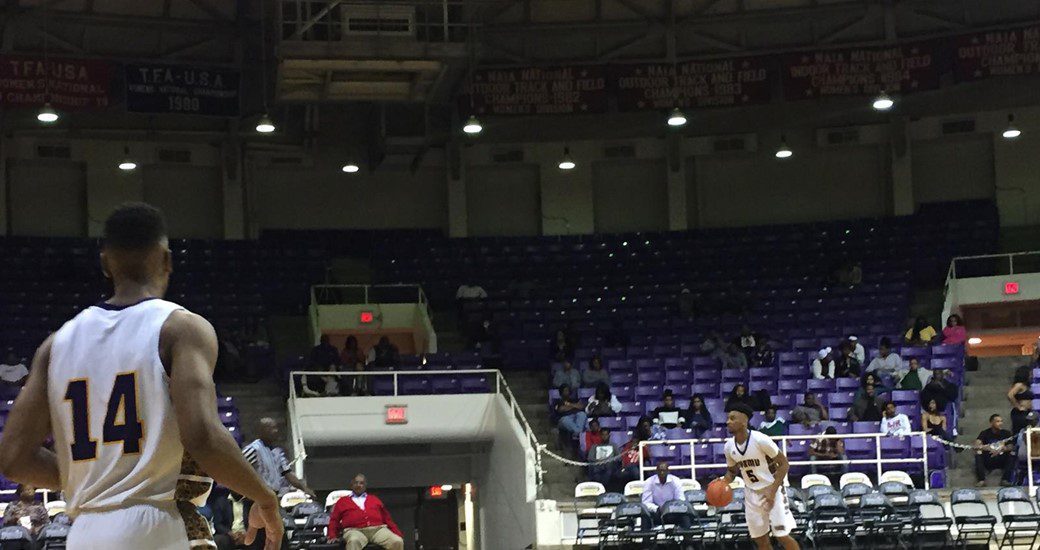 Image courtesy PVPanthers.com[/caption]
 Image courtesy SacredHeartPioneers.com[/caption]
1. Prairie View A&M vs Huston-Tillotson - Yet another HBCU vs HBCU matchup at the bottom of the attendance list this week. It seems that SWACtion isn't enough to put butts in the seats to see an NAIA team lose by 30. The Aggies of PV A&M beat the Rams 87-57 in front of 194 hearty souls. Your action shot:
[caption id="attachment_2467" align="aligncenter" width="1040"] Image courtesy PVPanthers.com[/caption]
Moving on... Let's go ahead with the miscellany:
Biggest group of people to see a loss at home this week: Louisville (vs Virginia) 21,676. Smallest group of people to see a win at home this week: PV A&M (vs Huston-Tillotson), 194. Smallest Power Conference attendance: Stanford (vs Arizona), 4,396. Average attendance this week: 4,716 (down 84 [1.8%] from last week). And as always, your full attendance numbers for the week:| Date | Conference | Home Team | Home Score | Away Team | Away Score | Attendance | Venue | Capacity | % Full |
|---|---|---|---|---|---|---|---|---|---|
| 12/28/2016 | SWAC | PV A&M | 87 | Huston-Tillotson | 57 | 194 | William Nicks Building | 6500 | 3.0% |
| 12/29/2016 | Northeast | Sacred Heart | 67 | Robert Morris | 78 | 242 | William H. Pitt Center | 2062 | 11.7% |
| 12/31/2016 | Northeast | Sacred Heart | 67 | St Francis (PA) | 87 | 275 | William H. Pitt Center | 2062 | 13.3% |
| 12/28/2016 | SWAC | Southern | 53 | SE Louisiana | 64 | 328 | F. G. Clark Activity Center | 7500 | 4.4% |
| 12/31/2016 | Big South | Charleston So | 70 | Liberty | 81 | 367 | CSU Field House | 881 | 41.7% |
| 12/28/2016 | Atlantic Sun | Jacksonville | 93 | Thomas (GA) | 64 | 374 | Swisher Gymnasium | 1500 | 24.9% |
| 12/30/2016 | Atlantic Sun | USC Upstate | 93 | Allen | 67 | 381 | Hodge Center | 878 | 43.4% |
| 12/31/2016 | Northeast | St Francis (BKN) | 86 | Cent Conn St | 77 | 412 | Pope Physical Education Center | 2000 | 20.6% |
| 12/29/2016 | Ivy League | Cornell | 96 | UMass Lowell | 98 | 422 | Newman Arena | 4473 | 9.4% |
| 12/28/2016 | Southland | Nicholls | 88 | Spring Hill | 64 | 433 | Stopher Gymnasium | 3800 | 11.4% |
| 12/31/2016 | Atlantic Sun | Jacksonville | 89 | S Carolina St | 85 | 450 | Swisher Gymnasium | 1500 | 30.0% |
| 12/31/2016 | Big West | UC Riverside | 76 | Grand Canyon | 56 | 470 | SRC Arena | 3168 | 14.8% |
| 12/29/2016 | Big South | Presbyterian | 61 | Liberty | 77 | 475 | Ross E. Templeton P.E. Center | 2300 | 20.7% |
| 12/31/2016 | Southland | Nicholls | 94 | Incarnate Word | 84 | 501 | Stopher Gymnasium | 3800 | 13.2% |
| 12/31/2016 | Big Sky | Sacramento St | 82 | North Dakota | 90 | 505 | The Nest | 900 | 56.1% |
| 12/31/2016 | Big Sky | Portland State | 59 | N Colorado | 73 | 506 | Stott Center | 1500 | 33.7% |
| 12/29/2016 | Northeast | St Francis (BKN) | 80 | Bryant | 77 | 513 | Pope Physical Education Center | 2000 | 25.7% |
| 12/31/2016 | Southland | New Orleans | 73 | Texas A&M-CC | 72 | 517 | Lakefront Arena | 10000 | 5.2% |
| 12/27/2016 | Ohio Valley | Tennessee St | 81 | Covenant | 50 | 522 | Gentry Center | 10500 | 5.0% |
| 12/30/2016 | Patriot League | American U | 66 | Loyola (MD) | 68 | 523 | Bender Arena | 4500 | 11.6% |
| 12/31/2016 | Southland | SE Louisiana | 75 | Abil Christian | 53 | 539 | University Center (LA) | 7500 | 7.2% |
| 12/31/2016 | Big Sky | N Arizona | 80 | Southern Utah | 93 | 581 | J. Lawrence Walkup Skydome | 16230 | 3.6% |
| 12/29/2016 | SWAC | Alabama State | 75 | Fort Valley St | 68 | 589 | Dunn-Oliver Acadome | 7400 | 8.0% |
| 12/31/2016 | Conference USA | FIU | 70 | Marshall | 94 | 598 | FIU Arena | 6000 | 10.0% |
| 12/31/2016 | Ivy League | Brown | 89 | Stony Brook | 92 | 617 | Pizzitola Sports Center | 2800 | 22.0% |
| 12/29/2016 | Ivy League | Brown | 66 | Quinnipiac | 61 | 622 | Pizzitola Sports Center | 2800 | 22.2% |
| 12/30/2016 | Patriot League | Boston U | 61 | Holy Cross | 55 | 632 | Case Gym | 1800 | 35.1% |
| 12/31/2016 | Northeast | LIU Brooklyn | 74 | Bryant | 63 | 638 | Wellness, Recreation and Athletic Center | 2500 | 25.5% |
| 12/31/2016 | Atlantic Sun | Kennesaw St | 89 | NorthGa | 76 | 653 | KSU Convocation Center | 4792 | 13.6% |
| 12/29/2016 | Big South | Charleston So | 68 | Winthrop | 84 | 665 | CSU Field House | 881 | 75.5% |
| 12/28/2016 | MEAC | NC Central | 88 | Truett-McConnell | 54 | 674 | McDougald-McLendon Gymnasium | 3056 | 22.1% |
| 12/31/2016 | Ivy League | Dartmouth | 63 | UNH | 62 | 701 | Edward Leede Arena | 2100 | 33.4% |
| 12/31/2016 | Big South | High Point | 55 | Longwood | 60 | 712 | Millis Athletic Center | 1750 | 40.7% |
| 12/29/2016 | Conference USA | UTSA | 79 | East Cen | 75 | 713 | UTSA Convocation Center | 4080 | 17.5% |
| 12/29/2016 | Big South | Longwood | 79 | Campbell | 77 | 718 | Willett Hall | 2522 | 28.5% |
| 12/31/2016 | Ohio Valley | SE Missouri St | 81 | E Kentucky | 48 | 720 | Show Me Center | 6972 | 10.3% |
| 12/30/2016 | MEAC | NC Central | 101 | Montreat | 66 | 773 | McDougald-McLendon Gymnasium | 3056 | 25.3% |
| 12/31/2016 | Big West | UC Davis | 83 | Utah Valley | 69 | 787 | The Pavilion (UC Davis) | 7926 | 9.9% |
| 12/30/2016 | SWAC | Jackson State | 94 | Fisk | 62 | 805 | Lee E. Williams Athletic and Assembly Center | 8000 | 10.1% |
| 12/29/2016 | Big South | Radford | 80 | UNC Asheville | 77 | 807 | Donald N. Dedmon Center | 3205 | 25.2% |
| 1/1/2017 | Conference USA | UTSA | 67 | UTEP | 55 | 816 | UTSA Convocation Center | 4080 | 20.0% |
| 12/31/2016 | Western Athletic | UT Rio Grande | 96 | Texas A&M-K'vil | 78 | 844 | UTRGV Fieldhouse | 2500 | 33.8% |
| 12/28/2016 | Colonial Athletic | Elon | 89 | Central Penn | 60 | 847 | Alumni Gym (Elon University) | 1585 | 53.4% |
| 12/28/2016 | Southern | Samford | 94 | Fort Valley St | 74 | 849 | Pete Hanna Center | 4974 | 17.1% |
| 12/29/2016 | Southland | Sam Houston | 65 | Houston Baptist | 79 | 860 | Bernard G. Johnson Coliseum | 6110 | 14.1% |
| 12/28/2016 | Southland | Northwestern St | 86 | Louisiana Coll. | 66 | 877 | Prather Coliseum | 3900 | 22.5% |
| 12/31/2016 | Conference USA | FAU | 54 | W Kentucky | 69 | 877 | FAU Arena | 5000 | 17.5% |
| 12/29/2016 | Northeast | Fair Dickinson | 77 | St Francis (PA) | 65 | 914 | Rothman Center | 5000 | 18.3% |
| 12/29/2016 | MAC | E Michigan | 98 | LBSU | 72 | 928 | Convocation Center (MI) | 8824 | 10.5% |
| 12/28/2016 | Southern | W Carolina | 87 | Mars Hill | 71 | 944 | Ramsey Center | 7826 | 12.1% |
| 12/29/2016 | Ohio Valley | SE Missouri St | 89 | Henderson St | 75 | 955 | Show Me Center | 6972 | 13.7% |
| 12/31/2016 | Colonial Athletic | Northeastern | 84 | William & Mary | 64 | 960 | Matthews Arena | 6000 | 16.0% |
| 12/31/2016 | Horizon League | Cleveland State | 62 | Milwaukee | 53 | 1013 | Wolstein Center | 13610 | 7.4% |
| 12/29/2016 | Big South | Gardner-Webb | 64 | High Point | 71 | 1014 | Paul Porter Arena | 5000 | 20.3% |
| 12/31/2016 | Summit League | Fort Wayne | 102 | Oral Roberts | 91 | 1015 | Hilliard Gates Sports Center | 2300 | 44.1% |
| 12/31/2016 | Southern | W Carolina | 48 | Chattanooga | 64 | 1020 | Ramsey Center | 7826 | 13.0% |
| 12/29/2016 | Western Athletic | UT Rio Grande | 97 | Lady of the Lake | 81 | 1028 | UTRGV Fieldhouse | 2500 | 41.1% |
| 12/28/2016 | Ohio Valley | E Kentucky | 70 | Virginia-Wise | 51 | 1050 | McBrayer Arena | 6500 | 16.2% |
| 12/31/2016 | Colonial Athletic | Elon | 54 | Charleston | 66 | 1055 | Alumni Gym (Elon University) | 1585 | 66.6% |
| 12/31/2016 | Ohio Valley | E Illinois | 56 | Jacksonville St | 57 | 1059 | Lantz Arena | 5300 | 20.0% |
| 12/28/2016 | Ohio Valley | SIU ED | 85 | Missouri S&T | 67 | 1071 | Vadalabene Center | 4157 | 25.8% |
| 12/31/2016 | Southern | Wofford | 88 | Mercer | 71 | 1083 | Benjamin Johnson Arena | 3500 | 30.9% |
| 12/31/2016 | MAC | N Illinois | 77 | IL-Springfield | 62 | 1083 | NIU Convocation Center | 10000 | 10.8% |
| 12/29/2016 | Northeast | LIU Brooklyn | 65 | Mt St Mary's | 67 | 1092 | Wellness, Recreation and Athletic Center | 2500 | 43.7% |
| 12/29/2016 | MAC | Miami (OH) | 89 | Olivet College | 69 | 1096 | Millett Hall | 6400 | 17.1% |
| 12/28/2016 | Summit League | IUPUI | 81 | Marian | 60 | 1104 | Indiana Farmers Coliseum | 6500 | 17.0% |
| 12/31/2016 | Mountain West | Air Force | 78 | Utah State | 73 | 1143 | Clune Arena | 5858 | 19.5% |
| 12/31/2016 | Big South | Winthrop | 80 | Radford | 82 | 1199 | Winthrop Coliseum | 6100 | 19.7% |
| 12/28/2016 | Southern | The Citadel | 87 | UNCG | 95 | 1221 | McAlister Field House | 6000 | 20.4% |
| 12/28/2016 | The American | Tulane | 72 | UCF | 85 | 1274 | Devlin Fieldhouse | 3600 | 35.4% |
| 12/29/2016 | Hoizon League | Detroit Mercy | 70 | N Kentucky | 81 | 1299 | Calihan Hall | 8295 | 15.7% |
| 12/31/2016 | Sun Belt | Texas State | 67 | Appalachian St | 58 | 1318 | Strahan Coliseum | 7200 | 18.3% |
| 12/30/2016 | Ivy League | Columbia | 67 | Albany | 70 | 1327 | Levien Gymnasium | 3408 | 38.9% |
| 12/29/2016 | Northeast | Wagner | 71 | Cent Conn St | 46 | 1333 | Spiro Sports Center | 2100 | 63.5% |
| 12/29/2016 | Summit League | Fort Wayne | 91 | W Illinois | 93 | 1345 | Hilliard Gates Sports Center | 2300 | 58.5% |
| 12/28/2016 | Summit League | Denver | 77 | Oral Roberts | 73 | 1347 | Magness Arena | 7200 | 18.7% |
| 12/31/2016 | West Coast | Santa Clara | 72 | San Francisco | 58 | 1389 | Leavey Center | 5000 | 27.8% |
| 12/28/2016 | Conference USA | FAU | 62 | FGCU | 75 | 1394 | FAU Arena | 5000 | 27.9% |
| 12/31/2016 | Horizon League | Youngstown St | 77 | Green Bay | 90 | 1402 | Beeghly Center | 6500 | 21.6% |
| 12/31/2016 | Big South | Campbell | 69 | Presbyterian | 58 | 1427 | Pope Convocation Center | 3095 | 46.1% |
| 12/29/2016 | Atlantic Sun | North Florida | 68 | Ball State | 73 | 1464 | UNF Arena | 5800 | 25.2% |
| 12/31/2016 | Southland | Northwestern St | 72 | McNeese | 79 | 1472 | Prather Coliseum | 3900 | 37.7% |
| 12/31/2016 | Big South | UNC Asheville | 90 | Gardner-Webb | 85 | 1491 | Kimmel Arena | 3200 | 46.6% |
| 12/28/2016 | Atlantic Sun | Kennesaw St | 76 | Mercer | 80 | 1506 | KSU Convocation Center | 4792 | 31.4% |
| 12/31/2016 | Southern | Furman | 83 | The Citadel | 68 | 1529 | Timmons Arena | 4000 | 38.2% |
| 12/30/2016 | Patriot League | Army | 59 | Lehigh | 66 | 1558 | Christl Arena | 5043 | 30.9% |
| 12/28/2016 | Ohio Valley | Morehead State | 120 | Asbury | 77 | 1587 | Ellis T. Johnson Arena | 6500 | 24.4% |
| 12/31/2016 | Colonial Athletic | Delaware | 56 | Hofstra | 58 | 1589 | Bob Carpenter Center | 5000 | 31.8% |
| 12/29/2016 | Ohio Valley | UT Martin | 72 | Jacksonville St | 90 | 1604 | Skyhawk Arena | 5000 | 32.1% |
| 12/31/2016 | West Coast | Portland | 73 | Pepperdine | 60 | 1624 | Chiles Center | 4852 | 33.5% |
| 12/28/2016 | Colonial Athletic | Georgia State | 65 | UMass | 74 | 1639 | GSU Sports Arena | 4500 | 36.4% |
| 12/29/2016 | Summit League | South Dakota | 86 | Omaha | 69 | 1665 | The DakotaDome | 10000 | 16.7% |
| 12/30/2016 | Atlantic 10 | Fordham | 72 | Duquesne | 75 | 1673 | Rose Hill Gymnasium | 3470 | 48.2% |
| 12/31/2016 | Southern | UNCG | 62 | Samford | 73 | 1673 | Greensboro Coliseum | 21273 | 7.9% |
| 1/1/2017 | Missouri Valley | Loyola (CHI) | 59 | Illinois State | 81 | 1678 | Joseph J. Gentile Center | 4486 | 37.4% |
| 12/31/2016 | Northeast | Mt St Mary's | 57 | Wagner | 56 | 1707 | Knott Arena | 3121 | 54.7% |
| 12/31/2016 | Ohio Valley | UT Martin | 81 | Morehead State | 77 | 1730 | Skyhawk Arena | 5000 | 34.6% |
| 12/31/2016 | Ohio Valley | Austin Peay | 77 | Belmont | 82 | 1757 | Dave Aaron Arena | 9000 | 19.5% |
| 12/28/2016 | Colonial Athletic | Delaware | 63 | Iona | 54 | 1776 | Bob Carpenter Center | 5000 | 35.5% |
| 12/31/2016 | Ohio Valley | SIU ED | 66 | Tenn Tech | 72 | 1781 | Vadalabene Center | 4157 | 42.8% |
| 12/31/2016 | Colonial Athletic | Towson | 67 | UNC Wilmington | 76 | 1795 | SECU Arena | 5250 | 34.2% |
| 12/31/2016 | MAAC | Iona | 93 | Marist | 80 | 1804 | Hynes Athletics Center | 2611 | 69.1% |
| 12/30/2016 | MAC | Bowling Green | 86 | Norfolk State | 77 | 1820 | Stroh Center | 4700 | 38.7% |
| 12/28/2016 | Ivy League | Princeton | 77 | Hampton | 49 | 1838 | Jadwin Gymnasium | 6854 | 26.8% |
| 12/26/2016 | West Coast | Loyola Mary | 70 | Morgan State | 49 | 1849 | Gersten Pavilion | 4156 | 44.5% |
| 12/31/2016 | Sun Belt | UT-Arlington | 90 | Coast Carolina | 69 | 1892 | College Park Center | 7000 | 27.0% |
| 12/28/2016 | Sun Belt | UL Monroe | 81 | Grambling | 45 | 1912 | Fant-Ewing Coliseum | 7085 | 27.0% |
| 12/30/2016 | Patriot League | Lafayette | 75 | Colgate | 85 | 1942 | Kirby Sports Center | 4000 | 48.6% |
| 12/31/2016 | Ivy League | Princeton | 81 | Cal Poly | 52 | 2022 | Jadwin Gymnasium | 6854 | 29.5% |
| 12/28/2016 | Horizon League | Valparaiso | 80 | Chicago State | 61 | 2024 | Athletics-Recreation Center | 5000 | 40.5% |
| 12/29/2016 | Ohio Valley | Murray State | 99 | Brescia | 83 | 2078 | CFSB Center | 8602 | 24.2% |
| 12/30/2016 | MEAC | Hampton | 94 | Coker | 69 | 2123 | Convocation Center (VA) | 7200 | 29.5% |
| 12/31/2016 | Big Sky | Montana State | 80 | Idaho State | 63 | 2138 | Brick Breeden Fieldhouse | 7250 | 29.5% |
| 12/29/2016 | MAC | W Michigan | 80 | Alabama A&M | 50 | 2260 | University Arena (MI) | 5421 | 41.7% |
| 12/31/2016 | Sun Belt | Little Rock | 79 | UL Monroe | 75 | 2287 | Jack Stephens Center | 5600 | 40.8% |
| 12/30/2016 | Patriot League | Navy | 55 | Bucknell | 59 | 2301 | Alumni Hall | 5710 | 40.3% |
| 12/30/2016 | Ivy League | Penn | 74 | Fairfield | 68 | 2304 | The Palestra | 8722 | 26.4% |
| 12/31/2016 | The American | USF | 56 | Houston | 70 | 2353 | USF Sun Dome | 10411 | 22.6% |
| 12/31/2016 | Sun Belt | Ga Southern | 88 | Georgia State | 65 | 2356 | W. S. Hanner Fieldhouse | 4325 | 54.5% |
| 12/31/2016 | Horizon League | Oakland | 76 | N Kentucky | 65 | 2417 | Athletics Center O'rena | 4005 | 60.3% |
| 12/30/2016 | America East | Binghamton | 101 | Marywood | 54 | 2440 | Events Center (Binghamton) | 5142 | 47.5% |
| 12/30/2016 | MAC | Cent Michigan | 90 | Chicago State | 82 | 2450 | McGuirk Arena | 5300 | 46.2% |
| 12/31/2016 | Southland | SF Austin | 61 | Houston Baptist | 51 | 2489 | William R. Johnson Coliseum | 7203 | 34.6% |
| 12/31/2016 | Summit League | South Dakota St | 73 | South Dakota | 72 | 2518 | Frost Arena | 6500 | 38.7% |
| 12/28/2016 | Colonial Athletic | JMU | 82 | EastMenn | 65 | 2670 | JMU Convocation Center | 7156 | 37.3% |
| 12/29/2016 | Horizon League | Oakland | 81 | Wright State | 62 | 2724 | Athletics Center O'rena | 4005 | 68.0% |
| 1/1/2017 | Conference USA | Southern Miss | 55 | LA Tech | 79 | 2761 | Reed Green Coliseum | 8095 | 34.1% |
| 12/29/2016 | Southern | ETSU | 92 | Savannah State | 71 | 2768 | Freedom Hall Civic Center | 5619 | 49.3% |
| 12/30/2016 | MAC | Buffalo | 79 | Maine | 60 | 2784 | Alumni Arena | 6100 | 45.6% |
| 12/28/2016 | Summit League | South Dakota St | 69 | North Dakota St | 80 | 2854 | Frost Arena | 6500 | 43.9% |
| 12/29/2016 | Horizon League | Youngstown St | 88 | Milwaukee | 87 | 2854 | Beeghly Center | 6500 | 43.9% |
| 12/31/2016 | West Coast | Pacific | 61 | Gonzaga | 81 | 2859 | Alex G. Spanos Center | 6150 | 46.5% |
| 12/31/2016 | West Coast | Saint Mary's | 72 | San Diego | 60 | 2891 | McKeon Pavilion | 3500 | 82.6% |
| 12/29/2016 | Missouri Valley | Drake | 102 | Loyola (CHI) | 98 | 3007 | The Knapp Center | 7152 | 42.0% |
| 12/31/2016 | Southern | ETSU | 102 | VMI | 75 | 3051 | Freedom Hall Civic Center | 5619 | 54.3% |
| 12/31/2016 | MAAC | Monmouth | 90 | Rider | 93 | 3128 | OceanFirst Bank Center | 4100 | 76.3% |
| 12/28/2016 | America East | Stony Brook | 61 | NJIT | 64 | 3130 | Island FCU Arena | 4000 | 78.3% |
| 12/31/2016 | Summit League | North Dakota St | 82 | Omaha | 70 | 3176 | Scheels Arena | 6000 | 52.9% |
| 12/31/2016 | Atlantic Sun | FGCU | 101 | Florida Tech | 49 | 3204 | Alico Arena | 4500 | 71.2% |
| 12/31/2016 | West Coast | Loyola Mary | 76 | BYU | 81 | 3221 | Gersten Pavilion | 4156 | 77.5% |
| 12/31/2016 | Ohio Valley | Murray State | 92 | Tennessee St | 83 | 3314 | CFSB Center | 8602 | 38.5% |
| 12/28/2016 | Atlantic 10 | Davidson | 105 | Hartford | 75 | 3513 | John M. Belk Arena | 5223 | 67.3% |
| 12/30/2016 | MAC | Toledo | 98 | Ohio Christian | 58 | 3610 | Savage Arena | 9000 | 40.1% |
| 12/31/2016 | The American | ECU | 44 | SMU | 75 | 3698 | Minges Coliseum | 8000 | 46.2% |
| 12/31/2016 | Conference USA | Charlotte | 101 | North Texas | 76 | 3792 | Halton Arena | 9105 | 41.6% |
| 12/30/2016 | Horizon League | UIC | 59 | Valparaiso | 70 | 3826 | UIC Pavilion | 6958 | 55.0% |
| 12/28/2016 | Ivy League | Penn | 75 | Drexel | 67 | 3836 | The Palestra | 8722 | 44.0% |
| 12/31/2016 | The American | UCF | 77 | Temple | 53 | 3906 | CFE Arena | 9465 | 41.3% |
| 12/27/2016 | Western Athletic | New Mexico St | 84 | E. New Mexico | 50 | 3912 | Pan American Center | 13071 | 29.9% |
| 12/28/2016 | Conference USA | W Kentucky | 97 | Austin Peay | 92 | 3913 | E. A. Diddle Arena | 7326 | 53.4% |
| 1/1/2017 | Missouri Valley | S Illinois | 83 | Drake | 69 | 4143 | SIU Arena | 8339 | 49.7% |
| 12/28/2016 | The American | ECU | 60 | USF | 49 | 4163 | Minges Coliseum | 8000 | 52.0% |
| 12/30/2016 | Atlantic 10 | Saint Joe's | 68 | G Washington | 63 | 4200 | Hagan Arena | 4200 | 100.0% |
| 1/1/2017 | Conference USA | Mid Tennessee | 60 | UAB | 49 | 4227 | Murphy Athletic Center | 11807 | 35.8% |
| 12/31/2016 | Atlantic 10 | Davidson | 80 | Richmond | 82 | 4249 | John M. Belk Arena | 5223 | 81.4% |
| 12/30/2016 | MAC | Ohio | 77 | Urbana | 50 | 4391 | Convocation Center (OH) | 13010 | 33.8% |
| 1/1/2017 | Pac 12 | Stanford | 52 | Arizona | 91 | 4396 | Maples Pavilion | 7329 | 60.0% |
| 12/31/2016 | Missouri Valley | Missouri State | 81 | Indiana State | 75 | 4400 | JQH Arena | 11000 | 40.0% |
| 12/31/2016 | The American | Tulsa | 61 | UConn | 59 | 4525 | Reynolds Center | 8355 | 54.2% |
| 12/28/2016 | Missouri Valley | Indiana State | 72 | Wichita State | 80 | 4550 | Hulman Center | 10200 | 44.6% |
| 12/30/2016 | Atlantic 10 | UMass | 77 | St Bonaventure | 89 | 4877 | William D. Mullins Memorial Center | 9493 | 51.4% |
| 12/28/2016 | Mountain West | Wyoming | 84 | Air Force | 72 | 5021 | Arena-Auditorium | 15028 | 33.4% |
| 12/28/2016 | ACC | Georgia Tech | 59 | NC A&T | 52 | 5024 | McCamish Pavilion | 9191 | 54.7% |
| 1/1/2017 | Big East | DePaul | 73 | St John's | 79 | 5152 | Allstate Arena | 17500 | 29.4% |
| 1/1/2017 | Missouri Valley | Evansville | 70 | Northern Iowa | 58 | 5277 | Ford Center | 19164 | 27.5% |
| 12/31/2016 | Mountain West | Boise State | 74 | Colorado State | 73 | 5413 | Taco Bell Arena | 12480 | 43.4% |
| 12/29/2016 | Missouri Valley | Illinois State | 62 | Evansville | 50 | 5415 | Redbird Arena | 10200 | 53.1% |
| 12/31/2016 | Conference USA | Old Dominion | 62 | Rice | 56 | 5431 | Ted Constant Convocation Center | 9520 | 57.0% |
| 12/28/2016 | Missouri Valley | Northern Iowa | 64 | Missouri State | 68 | 5448 | McLeod Center | 6650 | 81.9% |
| 12/28/2016 | ACC | Virginia Tech | 87 | UMBC | 70 | 5458 | Cassell Coliseum | 9847 | 55.4% |
| 12/28/2016 | The American | Temple | 50 | Cincinnati | 56 | 5478 | Liacouras Center | 10206 | 53.7% |
| 12/29/2016 | Big East | St John's | 76 | Butler | 73 | 5602 | Carnesecca Arena | 5602 | 100.0% |
| 12/30/2016 | Western Athletic | New Mexico St | 79 | UTEP | 70 | 5639 | Pan American Center | 13071 | 43.1% |
| 12/27/2016 | Big Ten | Penn State | 77 | Northwestern | 87 | 5811 | Bryce Jordan Center | 15261 | 38.1% |
| 12/29/2016 | Missouri Valley | Bradley | 60 | S Illinois | 51 | 5989 | Carver Arena | 11164 | 53.6% |
| 12/29/2016 | West Coast | Gonzaga | 92 | Pepperdine | 62 | 6000 | McCarthey Athletic Center | 6000 | 100.0% |
| 12/31/2016 | Mountain West | Fresno State | 77 | Nevada | 76 | 6043 | Save Mart Center | 15544 | 38.9% |
| 1/1/2017 | Big Ten | Rutgers | 47 | Penn State | 60 | 6079 | Louis Brown Athletic Center | 8000 | 76.0% |
| 12/29/2016 | MAAC | Siena | 60 | Vermont | 76 | 6176 | Times Union Center | 15229 | 40.6% |
| 12/28/2016 | Big East | Villanova | 68 | DePaul | 65 | 6500 | The Pavilion (Villanova) | 7926 | 82.0% |
| 12/30/2016 | Big 12 | TCU | 80 | Kansas | 86 | 6579 | Ed and Rae Schollmaier Arena | 7201 | 91.4% |
| 12/28/2016 | Western Athletic | Grand Canyon | 71 | Cal Poly | 64 | 6757 | GCU Arena | 7000 | 96.5% |
| 12/31/2016 | ACC | Miami | 81 | NC State | 63 | 6837 | Watsco Center | 7972 | 85.8% |
| 12/28/2016 | ACC | Miami | 78 | Columbia | 67 | 7045 | Watsco Center | 7972 | 88.4% |
| 12/29/2016 | SEC | Miss St | 77 | UMKC | 54 | 7109 | Humphrey Coliseum | 10575 | 67.2% |
| 12/29/2016 | Conference USA | Old Dominion | 54 | William & Mary | 65 | 7151 | Ted Constant Convocation Center | 9520 | 75.1% |
| 1/1/2017 | ACC | Boston College | 96 | Syracuse | 81 | 7226 | Silvio Conte Forum | 8606 | 84.0% |
| 12/28/2016 | Mountain West | Utah State | 80 | Boise State | 83 | 7227 | Dee Glen Smith Spectrum | 10270 | 70.4% |
| 12/27/2016 | Atlantic 10 | VCU | 85 | Howard | 51 | 7637 | Stuart C. Siegel Center | 7637 | 100.0% |
| 12/31/2016 | ACC | Georgia Tech | 75 | UNC | 63 | 7754 | McCamish Pavilion | 9191 | 84.4% |
| 12/30/2016 | Atlantic 10 | George Mason | 64 | VCU | 73 | 7780 | EagleBank Arena | 10000 | 77.8% |
| 12/29/2016 | SEC | LSU | 89 | Vanderbilt | 96 | 7853 | Pete Maravich Assembly Center | 14351 | 54.7% |
| 1/1/2017 | Big East | Seton Hall | 69 | Marquette | 66 | 7894 | Prudential Center | 17625 | 44.8% |
| 12/30/2016 | Atlantic 10 | Saint Louis | 56 | URI | 90 | 7945 | Chaifetz Arena | 10600 | 75.0% |
| 12/28/2016 | ACC | Pitt | 112 | Marshall | 106 | 8028 | Petersen Events Center | 12508 | 64.2% |
| 1/1/2017 | Big East | Butler | 78 | Providence | 61 | 8403 | Hinkle Fieldhouse | 9100 | 92.3% |
| 12/28/2016 | ACC | Notre Dame | 63 | St Peter's | 55 | 8550 | Purcell Pavilion | 9149 | 93.5% |
| 12/28/2016 | ACC | Clemson | 87 | UNC Wilmington | 73 | 8726 | Littlejohn Coliseum | 9000 | 97.0% |
| 12/28/2016 | ACC | FSU | 88 | Wake Forest | 72 | 8873 | Donald L. Tucker Center | 12100 | 73.3% |
| 12/29/2016 | SEC | Ole Miss | 76 | Kentucky | 99 | 9086 | The Pavilion at Ole Miss | 9500 | 95.6% |
| 12/29/2016 | SEC | Auburn | 84 | Georgia | 96 | 9121 | Auburn Arena | 9121 | 100.0% |
| 12/29/2016 | SEC | Texas A&M | 63 | Tennessee | 73 | 9199 | Reed Arena | 12989 | 70.8% |
| 1/1/2017 | Pac 12 | Washington | 74 | Washington St | 79 | 9259 | Alaska Airlines Arena | 12961 | 71.4% |
| 12/31/2016 | Mountain West | UNLV | 81 | Wyoming | 75 | 9352 | Thomas & Mack Center | 18776 | 49.8% |
| 12/31/2016 | ACC | Virginia Tech | 89 | Duke | 75 | 9567 | Cassell Coliseum | 9847 | 97.2% |
| 12/31/2016 | ACC | Wake Forest | 68 | Clemson | 73 | 10034 | Lawrence Joel Coliseum | 14665 | 68.4% |
| 12/27/2016 | SEC | South Carolina | 90 | Lander | 62 | 10088 | Colonial Life Arena | 18000 | 56.0% |
| 12/31/2016 | ACC | Pitt | 77 | Notre Dame | 78 | 10131 | Petersen Events Center | 12508 | 81.0% |
| 12/30/2016 | Big 12 | Oklahoma | 50 | Baylor | 76 | 10254 | Lloyd Noble Center | 11528 | 88.9% |
| 12/27/2016 | The American | Memphis | 54 | SMU | 58 | 10305 | FedExForum | 18119 | 56.9% |
| 1/1/2017 | The American | Cincinnati | 92 | Tulane | 56 | 10328 | Fifth Third Arena | 13176 | 78.4% |
| 12/28/2016 | Big East | Xavier | 82 | Providence | 56 | 10426 | Cintas Center | 10250 | 101.7% |
| 1/1/2017 | Missouri Valley | Wichita State | 100 | Bradley | 66 | 10506 | Charles Koch Arena | 10506 | 100.0% |
| 12/27/2016 | Big 12 | Texas | 58 | Kent State | 63 | 10658 | Frank Erwin Center | 16837 | 63.3% |
| 12/30/2016 | The American | Memphis | 70 | South Carolina | 54 | 10812 | FedExForum | 18119 | 59.7% |
| 12/29/2016 | SEC | Alabama | 83 | Stetson | 60 | 11128 | Coleman Coliseum | 15383 | 72.3% |
| 12/31/2016 | Big East | Georgetown | 76 | Xavier | 81 | 11275 | Verizon Center | 18506 | 60.9% |
| 12/28/2016 | The American | UConn | 46 | Houston | 62 | 11538 | XL Center | 15564 | 74.1% |
| 12/28/2016 | Mountain West | New Mexico | 78 | Fresno State | 73 | 11844 | WisePies Arena | 15411 | 76.9% |
| 1/1/2017 | Pac 12 | Utah | 76 | Colorado | 60 | 12108 | Jon M. Huntsman Center | 15000 | 80.7% |
| 1/1/2017 | Big Ten | Illinois | 75 | OSU | 70 | 12221 | State Farm Center | 15500 | 78.8% |
| 1/1/2017 | Mountain West | San Diego State | 62 | New Mexico | 68 | 12414 | Viejas Arena | 12414 | 100.0% |
| 12/30/2016 | Big 12 | Kansas State | 65 | Texas | 62 | 12528 | Bramlage Coliseum | 13762 | 91.0% |
| 12/30/2016 | Atlantic 10 | Dayton | 66 | La Salle | 55 | 12963 | University of Dayton Arena | 13435 | 96.5% |
| 12/30/2016 | Big 12 | Oklahoma State | 75 | West Virginia | 92 | 13611 | Gallagher-Iba Arena | 13611 | 100.0% |
| 1/1/2017 | Big Ten | Iowa | 86 | Michigan | 83 | 13988 | Carver-Hawkeye Arena | 15500 | 90.2% |
| 12/30/2016 | Big 12 | Iowa State | 63 | Texas Tech | 56 | 14384 | Hilton Coliseum | 14356 | 100.2% |
| 1/1/2017 | Big Ten | Purdue | 82 | Minnesota | 91 | 14428 | Mackey Arena | 14846 | 97.2% |
| 12/31/2016 | ACC | UVA | 58 | FSU | 60 | 14623 | John Paul Jones Arena | 14593 | 100.2% |
| 12/30/2016 | Big Ten | Michigan State | 61 | Northwestern | 52 | 14797 | Breslin Center | 16280 | 90.9% |
| 12/28/2016 | Big Ten | Purdue | 89 | Iowa | 67 | 14804 | Mackey Arena | 14846 | 99.7% |
| 12/28/2016 | Big East | Marquette | 76 | Georgetown | 66 | 14886 | BMO Harris Bradley Center | 17845 | 83.4% |
| 1/1/2017 | Big Ten | Maryland | 65 | Nebraska | 67 | 15067 | XFINITY Center | 17950 | 83.9% |
| 12/28/2016 | ACC | NC State | 99 | Rider | 71 | 16111 | PNC Arena | 18680 | 86.2% |
| 12/28/2016 | Big Ten | Indiana | 83 | Nebraska | 87 | 16168 | Assembly Hall (Indiana) | 17472 | 92.5% |
| 12/27/2016 | Big Ten | Wisconsin | 72 | Rutgers | 52 | 17287 | Kohl Center | 17230 | 100.3% |
| 12/29/2016 | West Coast | BYU | 89 | Santa Clara | 59 | 17415 | Marriott Center | 22700 | 76.7% |
| 12/27/2016 | Big Ten | Maryland | 84 | Illinois | 59 | 17950 | XFINITY Center | 17950 | 100.0% |
| 12/28/2016 | Big East | Creighton | 89 | Seton Hall | 75 | 18084 | CenturyLink Center Omaha | 17100 | 105.8% |
| 12/31/2016 | Big Ten | Indiana | 62 | Louisville | 77 | 18824 | Bankers Life Fieldhouse | 18165 | 103.6% |
| 12/31/2016 | Big East | Creighton | 70 | Villanova | 80 | 18831 | CenturyLink Center Omaha | 17100 | 110.1% |
| 12/28/2016 | ACC | UNC | 102 | Monmouth | 74 | 20064 | Dean E. Smith Center | 21750 | 92.2% |
| 12/29/2016 | SEC | Arkansas | 72 | Florida | 81 | 20355 | Bud Walton Arena | 20320 | 100.2% |
| 12/27/2016 | ACC | Syracuse | 80 | Cornell | 56 | 20557 | Carrier Dome | 35446 | 58.0% |
| 12/28/2016 | ACC | Louisville | 53 | UVA | 61 | 21676 | KFC Yum! Center | 22090 | 98.1% |